
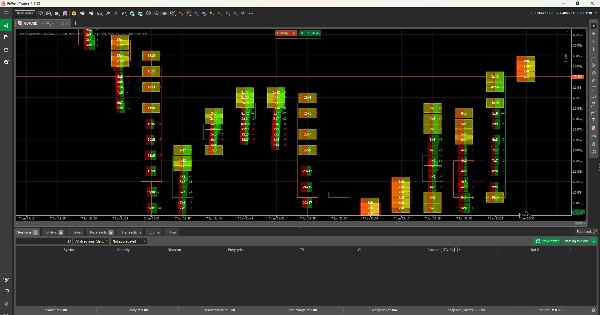
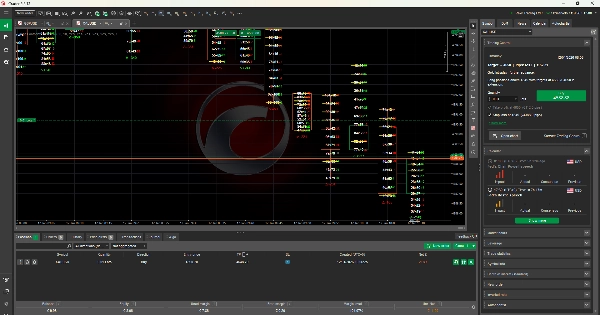
Delta Footprint Bid x Ask
Indikator
2 käufe
Version 2.0, Feb 2026
Windows, Mac
4.5
Bewertungen: 2
Beschreibung
Was enthalten ist:
- Überblick - Was der Indikator macht
- Footprint-Konzept - Was Footprint-Trading ist
- Detaillierte Berechnungsmethode - Wie die Volumina berechnet werden:
-
- Preisniveau-Erstellung
- Volumenverteilungsalgorithmus
- Logik der Kauf-/Verkaufsteilung
- Beispielberechnungen
- Erklärung der Volumenanzeige - Was "45x120" bedeutet
- Delta-Interpretation - Positiv, negativ und kumulativ
- Hauptmerkmale - Ungleichgewichte, POC, Volumenbalken
- Order Flow Theorie - Erklärung von Bid vs Ask
- Wichtige Einschränkungen - Ehrliche Erklärung, dass es geschätzt ist, keine echten Tick-Daten
- Handelsanwendungen - 5 reale Handelsszenarien
- Einstellungsanleitung - Vollständige Erklärung aller Parameter
- Zeitempfehlungen - Beste Einstellungen für verschiedene Stile
- Tipps & Best Practices
Wichtige Punkte zur Berechnung:
Das Dokument erklärt klar, dass:
Volumina GESCHÄTZT sind - weil cTrader keine echten Tick-Daten liefert Algorithmus intelligent ist - verwendet mehrere Faktoren (Kerzentyp, Preisposition, Nähe zum Schluss) Muster genau sind - relative Beziehungen spiegeln den echten Order Flow wider Ehrlich bezüglich Einschränkungen ist - erklärt, wann echte Börsendaten benötigt werden Exakte Formeln zeigt - vollständige Transparenz bei den Berechnungen
Dies gibt den Nutzern realistische Erwartungen und hebt gleichzeitig den Wert des Indikators hervor! 📊
Zusammenfassung
KI-Zusammenfassung
Delta Footprint Bid x Ask is a footprint volume indicator designed to display bid and ask volume splits at each price level. It estimates volume distribution using an intelligent algorithm that incorporates factors such as candle type, price position, and close proximity, as real tick data is not available on the cTrader platform. The indicator provides detailed volume calculations, including price level creation, buy/sell split logic, and example computations, offering transparency through exact formulas. Key features include identification of volume imbalances, point of control (POC), and volume bars, supporting analysis of order flow by comparing bid versus ask volumes. The indicator explains delta values—positive, negative, and cumulative—and offers guidance on settings and timeframe recommendations for various trading styles. It is applicable across multiple markets and symbols, including Forex pairs (EURUSD, GBPUSD, USDJPY, NZDUSD), indices (NAS100, SP500, DAX), commodities (gold, oil, silver), cryptocurrencies (BTCUSD), and stocks. The tool includes practical trading applications and best practices, helping users interpret footprint patterns that realistically mirror order flow despite volume estimates.
Indikatorprofil
Kundenbewertungen
4.5
Bewertungen: 2
5 | 50 % | |
4 | 50 % | |
3 | 0 % | |
2 | 0 % | |
1 | 0 % |
Kundenbewertungen
January 20, 2026
For volume based context, this feels more useful as a filter than a full system. The journal should cover 55 setups and the trade context.
January 12, 2026
For me the fair test is value area with POC and VWAP. If the result still looks clean, the product becomes easier to trust.
Diskussion
Häufig gestellte Fragen (FAQ)
BTCUSD
Forex
Signal
Indices
EURUSD
Commodities
GBPUSD
NZDUSD
Prop
Scalping
Supertrend
Fair Value Gap
Crypto
Stocks
XAUUSD
NAS100
USDJPY
Über den cTrader Store verfügbare Produkte, einschließlich Handelsbots, Indikatoren und Plugins, werden von externen Entwicklern bereitgestellt und nur zu Informations- und technischen Zugriffszwecken verfügbar gemacht. cTrader Store ist kein Broker und erbringt keine Anlageberatung, persönlichen Empfehlungen oder eine Garantie für zukünftige Performance.
Mehr von diesem Autor


![„Wyckoff Toolkit [Iridio Capital]“-Logo](https://cdn.ctrader.com/image/webp/8acfe6a1-6a8e-4578-9367-9df3af2b1801_27763)


Preis
Seit 15/01/2025
7
Verkäufe