Beschreibung
═══════════════════════════════════════════════════════════════
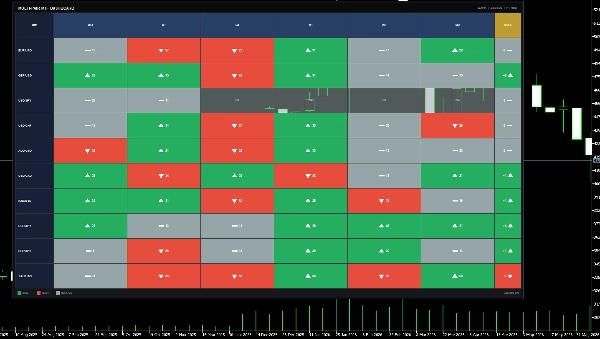
ARGUS — MULTI-PAIR MTF DASHBOARD
The Sons
═══════════════════════════════════════════════════════════════
Benannt nach Argus Panoptes, dem hundertäugigen Wächter der griechischen Mythologie,
der niemals alle Augen gleichzeitig schloss — dieses Dashboard behält den Überblick
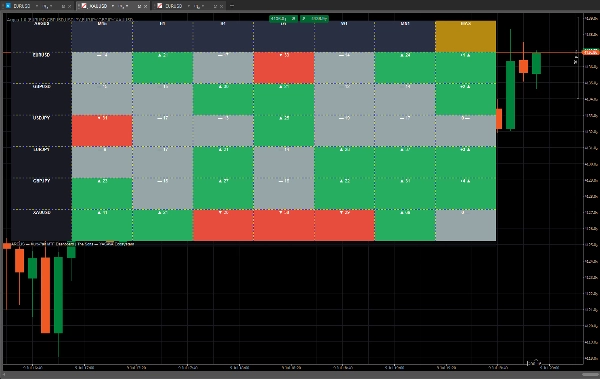
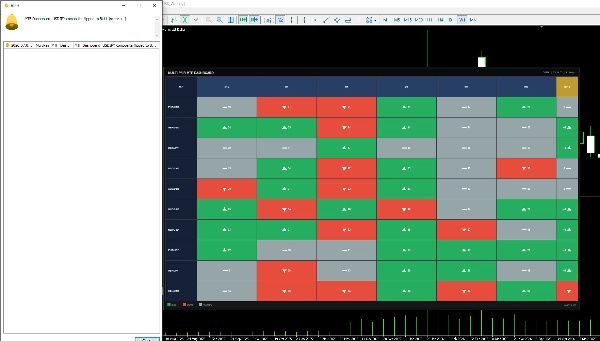
über 60 Bias-Zellen verteilt auf 10 Symbole und 6 Zeitrahmen gleichzeitig,
ohne dass Sie eine einzige Chart-Registerkarte berühren müssen.
───────────────────────────────────────────────────────────────
WAS ES TUT
───────────────────────────────────────────────────────────────
Eine Trendbestätigung über Zeitrahmen hinweg bedeutet normalerweise, jede
Chart eines Paares zu öffnen und manuell durch M15, H1, H4, D1, W1 und MN1 zu blättern,
EMA-Steigung, MACD-Zustand und ADX-Stärke auf jedem einzelnen zu lesen —
dann das Ganze für das nächste Symbol zu wiederholen. Zehn Paare, sechs Zeitrahmen
jeweils, sind sechzig manuelle Prüfungen, bevor Sie einen einzigen Trade platziert haben.
ARGUS führt diese gesamte Prüfung kontinuierlich im Hintergrund aus und
stellt sie als ein festes Raster dar. Jede Zelle wird durch eine 3-Signal-Abstimmung
(EMA-Trend, MACD-Momentum, DI+/DI- Richtung) bewertet und durch
einen ADX-Stärkefilter gesteuert, sodass ein schwacher oder unruhiger Markt neutral
statt eines falschen Pfeils anzeigt. Jede Symbolreihe wird außerdem zu einem
einzigen zusammengesetzten BIAS-Wert zusammengefasst, sodass eine vollständige Multi-Zeitrahmen-Ausrichtung
auf einen Blick sichtbar ist — kein Scrollen, kein Registerkartenwechsel.
───────────────────────────────────────────────────────────────
DASHBOARD — BIS ZU 10 SYMBOLE × 6 ZEITRAHMEN
───────────────────────────────────────────────────────────────
Spalte Was sie zeigt
──────────── ──────────────────────────────────────────────
Symbol Zeilenbeschriftung pro konfiguriertem Paar
Pro-Zeitrahmen-Zellen ▲ Bull / ▼ Bear / — Neutral, farbcodiert
Optionaler ADX-Stärkewert neben dem Symbol angezeigt
"n/a", wenn ein Symbol/Zeitfenster zu wenig
Historie zum Berechnen hat — es wird nie geraten
BIAS Zusammengesetzter Wert = bullische TFs − bärische TFs
für diese Zeile, angezeigt z.B. als "+3 ▲" oder "-2 ▼"
Umschaltbar ein/aus
Eine Zelle wird nur grün oder rot, wenn mindestens 2 der 3 Signale
übereinstimmen UND der ADX Ihren konfigurierten Schwellenwert überschreitet. Alles Schwächere
bleibt per Design neutral.
───────────────────────────────────────────────────────────────
FUNKTIONEN
───────────────────────────────────────────────────────────────
SIGNAL-ENGINE
- EMA Fast/Slow Crossover-Trend, konfigurierbare Perioden
- MACD Linie/Signal/Histogramm Momentum-Bestätigung
- Wilder ADX + DI+/DI- Stärke- und Richtungsfilter
- Liest nur die letzte vollständig geschlossene Kerze — Signal ist stabil,
malt nie mitten in der Kerze neu
- Korrigiert automatisch eine invertierte EMA Fast/Slow Eingabe und protokolliert dies,
anstatt eine fehlerhafte Lesung zu erzeugen
FELSENFESTES PANEL
- Bleibt genau dort, wo Sie es platzieren — kein Verrutschen, Verziehen oder
Neupositionieren beim Zoomen oder Scrollen des Charts
- Aktualisiert sich flüssig an Ort und Stelle, Tick für Tick, ohne Flackern
ZUSAMMENGESETZTE BIAS-SPALTE
- Netto-Bullen-minus-Bären-Abstimmung über alle konfigurierten Zeitrahmen
- Zeigt sofort, welche Paare in jedem Zeitrahmen in dieselbe Richtung ziehen
und welche widersprüchlich sind
UMSCHALT-ALERTE
- Tonbenachrichtigung + Nachricht im Panel in dem Moment, in dem sich der
zusammengesetzte Bias eines Symbols ändert
- Keine Fehlalarm beim ersten Laden — nur echte Umschaltungen werden gemeldet
- Ein Benachrichtigungsfehler beeinträchtigt niemals das Dashboard selbst
IMMER AKTUELL
- Das Dashboard spiegelt die aktuellen Marktbedingungen wider, sodass Sie
nie eine veraltete Lesung sehen
LEICHTGEWICHT & SICHER
- Läuft vollständig innerhalb des Charts — kein Datei-Zugriff, keine externen
Verbindungen, nichts, das außerhalb von cTrader reicht
───────────────────────────────────────────────────────────────
STRATEGIE — WIE MAN ES BENUTZT
───────────────────────────────────────────────────────────────
SCHRITT 1 — BIAS FESTLEGEN (Höhere Zeitrahmen)
- Lesen Sie die D1- und W1-Zellen für die Symbolreihe
- Übereinstimmende Farbe in beiden = höherer Zeitrahmen-Trend bestätigt
SCHRITT 2 — KONFLUENZ PRÜFEN
- Lesen Sie den BIAS-Spaltenwert für diese Zeile
- Ein hoher positiver/negativer Wert bedeutet, dass die meisten Zeitrahmen übereinstimmen;
ein niedriger oder gemischter Wert bedeutet, dass das Paar widersprüchlich ist — überspringen Sie es
SCHRITT 3 — ZUM EINSTIEGSZEITRAHMEN WECHSELN
- Öffnen Sie das eigene Chart des Paares auf Ihrem Handelszeitrahmen
- Nehmen Sie nur Einstiege in die Richtung, die ARGUS' höherer Zeitrahmen
Bias bereits bestätigt hat
- Aktivieren Sie den ADX-Stärkewert in der Zelle, um zu beurteilen, wie stark
diese Bestätigung aktuell ist, nicht nur anhand der Farbe
SCHRITT 4 — LASSEN SIE DIE UMSCHALT-ALERTE DIE ÜBERWACHUNG ÜBERNEHMEN
- Schalten Sie die Alarmfunktion bei zusammengesetztem Flip ein und entfernen Sie sich vom Bildschirm
- Lassen Sie sich sofort benachrichtigen, wenn sich der Gesamt-Bias eines Paares ändert,
anstatt jede Chart manuell erneut zu überprüfen
───────────────────────────────────────────────────────────────
PARAMETERGRUPPEN
───────────────────────────────────────────────────────────────
1. Symbole & Zeitrahmen — CSV-Liste, bis zu 10 Symbole / 6 TFs
2. EMA — Fast / Slow Perioden
3. MACD — Fast / Slow / Signal Perioden
4. ADX — Periode, Schwellenwert (10–50)
5. Erscheinungsbild — Bull/Bear/Neutral/Textfarben, Zellbreite/-höhe,
Panel X/Y-Versatz, zusammengesetzte Spalte anzeigen, ADX-Stärke anzeigen
6. Alarme — Alarm bei zusammengesetztem Flip
7. Daten — Zu ladende Bars (100–2000)
───────────────────────────────────────────────────────────────
FÜR WEN ES GEEIGNET IST
───────────────────────────────────────────────────────────────
- Swing-/Positionshändler, die Setups über Zeitrahmen hinweg bestätigen
bevor sie einsteigen
- Multi-Paar-Händler, die mehrere Instrumente nach der
stärksten Gelegenheit gerade jetzt durchsuchen
- Jeder, der ein festes, immer genaues Panel statt
von sechzig manuellen Chart-Prüfungen möchte
Zusammenfassung
Key features include stable, non-repainting signals derived from fully closed bars, automatic correction of inverted EMA inputs, and a fixed panel position that updates smoothly without flicker. Users can configure symbols, timeframes, indicator parameters, appearance, and alert settings. Flip alerts notify users instantly when a symbol’s composite bias changes direction.
The dashboard supports swing and position traders who require multi-timeframe trend confirmation and multi-pair scanning without manual chart switching. It runs entirely within the chart environment, ensuring lightweight and secure operation with live market data updates.
Kundenbewertungen
5 | 100 % | |
4 | 0 % | |
3 | 0 % | |
2 | 0 % | |
1 | 0 % |
















![„[Stellar Strategies] Smart ADX“-Logo](https://cdn.ctrader.com/image/webp/af13b084-b6f6-41db-b7bc-c7e688b57b05_36929)