Penerangan
Demo Panel Pemasa Lilin & Kekuatan untuk cTrader
VERSI DEMO – Percubaan percuma selama 24 jam!
Ini adalah versi DEMO penunjuk Panel Pemasa Lilin & Kekuatan untuk cTrader.
Anda boleh menggunakan semua ciri selama 24 jam selepas pemasangan.
Selepas tempoh percubaan, penunjuk akan tamat tempoh dan memaparkan mesej.
Untuk mendapatkan versi penuh, cari "Candle Timer & Strength Panel" di Kedai cTrader.
Ciri-ciri Utama:
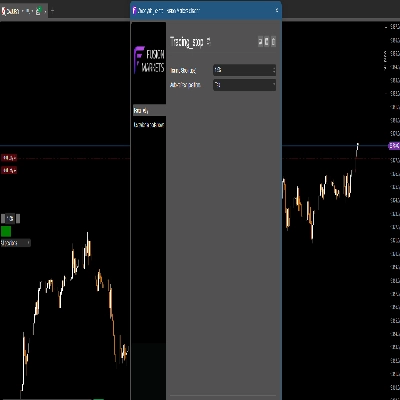
- Panel Overlay Tetap:
-
- Pemasa dan kekuatan untuk setiap jangka masa yang dipilih sentiasa kelihatan dalam satu panel yang mudah dibaca di bahagian atas carta anda.
- Pilih kedudukan panel: kiri, tengah, atau kanan.
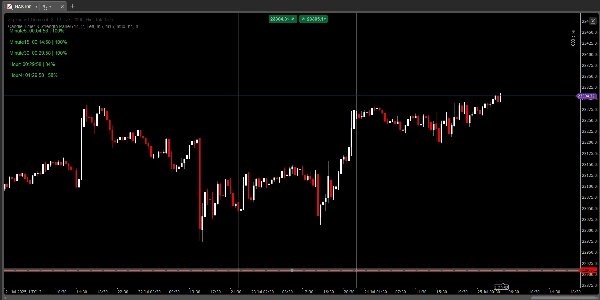
- Pemasa Lilin Berbilang Jangka Masa:
-
- Lihat kiraan masa ke penutupan lilin seterusnya pada sehingga 5 jangka masa yang dipilih.
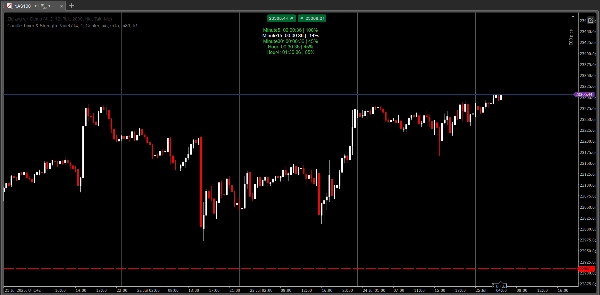
- Kekuatan Lilin dalam %:
-
- Lihat serta-merta kekuatan lilin semasa (dari -100% hingga +100%) untuk setiap jangka masa, berdasarkan di mana penutupan berbanding dengan julat lilin.
- Kod warna dinamik: hijau untuk bullish kuat, merah untuk bearish kuat, putih untuk neutral.
- Paparan Boleh Disesuaikan:
-
- Tetapkan saiz fon, jarak menegak, dan kedudukan panel.
- Pilih jangka masa pilihan anda (M1, M5, M15, M30, H1, H4, dan lain-lain).
- Parameter Jam Mula H4 untuk broker dengan lilin H4 bukan standard.
- Sesuai untuk:
-
- Scalpers dan pedagang harian yang memerlukan masa lilin dan momentum yang tepat dengan cepat.
- Pedagang berbilang jangka masa yang mahukan papan pemuka yang bersih dan sentiasa kelihatan.
- Sesiapa yang ingin meningkatkan kemahiran masa masuk/keluar dan bacaan lilin mereka.
Apa bezanya dengan Candle Timer & Strength standard?
- Versi panel:
-
- Semua pemasa dan kekuatan dipaparkan dalam panel tetap di bahagian atas carta (bukan di sebelah lilin).
- Panel tidak bergerak atau hilang apabila anda zum atau skrol – ia sentiasa di tempat yang sama.
- Lebih mudah dibaca dan lebih profesional untuk membuat keputusan pantas dan analisis berbilang jangka masa.
- Versi standard:
-
- Pemasa dan kekuatan dipaparkan di sebelah lilin terakhir pada carta dan mungkin bergerak atau bertindih dengan tindakan harga apabila anda zum atau skrol.
Parameter:
- Jarak Menegak (baris)
- Kedudukan Mendatar Panel (kiri, tengah, kanan)
- Jangka Masa 1–5 (custom)
- Jam Mula H4 (untuk broker dengan lilin H4 bukan standard)
Mengapa pilih Panel Pemasa Lilin & Kekuatan?
- Sentiasa lihat data masa dan momentum paling penting – tidak kira bagaimana anda zum atau skrol.
- Sesuai untuk perdagangan berbilang jangka masa dan pantas.
- Penampilan bersih, moden, dan profesional.
- Mudah digunakan, boleh disesuaikan sepenuhnya, dan ringan.
Cuba Panel Pemasa Lilin & Kekuatan dan tingkatkan perdagangan berbilang jangka masa anda ke tahap seterusnya!
Lihat semua penunjuk dan bot saya:
https://ctrader.com/pl?search=kobud.222&u=kobud.222
http://www.youtube.com/@Robi22-22
📩 Soalan? Cadangan? Diskaun?
Hubungi tersedia dalam profil saya: Robikobud