
Penerangan
Demo Amaran Pintar ZigZag untuk cTrader
VERSI DEMO – Percubaan percuma 24 jam!
Ini adalah versi DEMO penunjuk Amaran Pintar ZigZag untuk cTrader.
Anda boleh menggunakan semua ciri selama 24 jam selepas pemasangan.
Selepas tempoh percubaan, penunjuk akan tamat tempoh dan memaparkan mesej.
Untuk mendapatkan versi penuh, cari "ZigZag Smart Alert" di Kedai cTrader.
Ciri-ciri Utama:
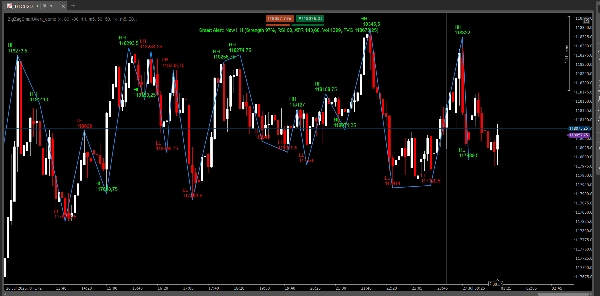
- Amaran Penapis Pelbagai Pintar:
-
- Terima amaran bunyi dan/atau visual hanya apabila ayunan baru (HH/LL) muncul dan semua penapis tersuai anda dipenuhi (kekuatan lilin, RSI, ATR, volum, FVG).
- Anak panah kemasukan menunjukkan dengan tepat di mana isyarat berlaku.
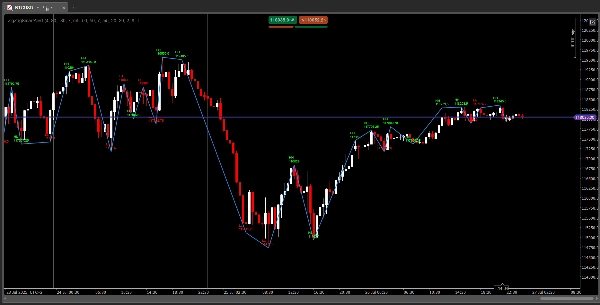
- Struktur ZigZag Klasik:
-
- Mengesan dan melabel semua ayunan tinggi dan rendah (HH, HL, LH, LL) dengan warna dan saiz fon yang boleh disesuaikan.
- Kepekaan dan ketebalan garis boleh laras.
- Integrasi Jurang Nilai Adil (FVG):
-
- Amaran hanya apabila ayunan disahkan oleh harga yang ditutup di atas/bawah FVG terdekat.
- Penapis RSI, ATR, Volum:
-
- Tetapkan ambang dan jangka masa anda sendiri untuk RSI dan ATR.
- Tapis isyarat mengikut kekuatan lilin dan volum tick.
- Eksport Ayunan ke CSV:
-
- Simpan semua ayunan yang dikesan (indeks, masa, jenis, harga) ke fail CSV untuk analisis atau pencatatan lanjut.
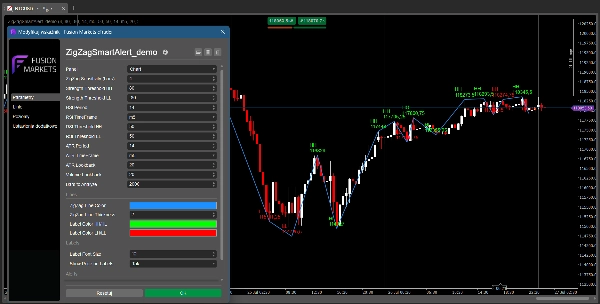
- Mudah Digunakan, Sepenuhnya Boleh Disesuaikan:
-
- Semua parameter tersedia dalam panel tetapan.
- Berfungsi pada mana-mana instrumen dan jangka masa.
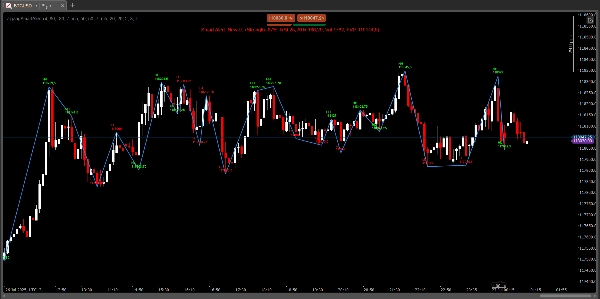
Cara ia berfungsi:
- Penunjuk mengimbas carta untuk tinggi dan rendah tempatan berdasarkan kepekaan yang anda pilih.
- Setiap ayunan dilabel sebagai HH, HL, LH, atau LL, dan disambungkan dengan garis ZigZag.
- Apabila HH atau LL baru muncul dan semua syarat penapis dipenuhi, anda akan mendapat amaran bunyi dan/atau visual segera, dan anak panah kemasukan dilukis pada carta.
- Semua ayunan boleh dieksport ke fail CSV untuk rekod anda.
Tetapan yang disyorkan untuk gaya perdagangan yang berbeza:
Scalping (contoh: M1, M5):
- Kepekaan ZigZag: 4
- Tempoh RSI: 7
- Jangka Masa RSI: M5
- Ambang RSI: 80/20
- Tempoh ATR: 7
- Jangka Masa ATR: M1
Perdagangan Harian (contoh: M15, M30):
- Kepekaan ZigZag: 4
- Tempoh RSI: 14
- Jangka Masa RSI: M15
- Ambang RSI: 70/30
- Tempoh ATR: 14
- Jangka Masa ATR: M15
Perdagangan Swing (contoh: H1, H4):
- Kepekaan ZigZag: 4
- Tempoh RSI: 14–21
- Jangka Masa RSI: H4
- Ambang RSI: 70/30
- Tempoh ATR: 14
- Jangka Masa ATR: H4
Anda boleh menyesuaikan tetapan ini untuk menepati strategi dan keadaan pasaran anda sendiri.
Parameter:
- Kepekaan ZigZag (bar)
- Ambang Kekuatan (untuk HH/LL)
- Tempoh & Jangka Masa RSI, Ambang RSI
- Tempoh & Jangka Masa ATR, Lihat Kembali ATR
- Lihat Kembali Volum
- Warna & Ketebalan Garis ZigZag
- Warna Label & Saiz Fon
- Paparkan Harga pada Label (ya/tidak)
- Bar untuk Dianalisis
- Aktifkan Amaran Bunyi (ya/tidak)
- Aktifkan Amaran Visual (ya/tidak)
- Aktifkan Eksport ke CSV (ya/tidak)
Mengapa memilih Amaran Pintar ZigZag?
- Dapatkan hanya isyarat terbaik – tiada lagi bunyi bising, hanya susunan berkemungkinan tinggi.
- Sesuai untuk tindakan harga, SMC, ICT, dan strategi perdagangan swing.
- Lihat dengan tepat di mana untuk masuk – dengan anak panah kemasukan dan konteks penuh.
- Mudah digunakan, sepenuhnya boleh disesuaikan, dan penampilan profesional.
Cuba Amaran Pintar ZigZag dan bawa perdagangan swing anda ke tahap seterusnya!
Penunjuk lain oleh pengarang ini:
- Demo Pemasa & Kekuatan Lilin
- Pemasa & Kekuatan Lilin Penuh
- Panel Pemasa & Kekuatan Lilin
- Penjejak MultiTF FVG
- Demo ZigZag Pro (tambah pautan anda)
- ZigZag Pro Penuh (tambah pautan anda)
📩 Soalan? Cadangan? Diskaun?
Hubungi tersedia dalam profil saya: Robikobud
https://ctrader.com/pl?search=kobud.222&u=kobud.222
http://www.youtube.com/@Robi22-22


![Logo "[CB] Pivot Points Pro"](https://cdn.ctrader.com/image/webp/43463c82-67b0-4f10-a4ba-901bba091d81_32594)


