
Beschreibung
VOLUME HEATMAP PRO - Professionelle Markt-Dichte-Visualisierung
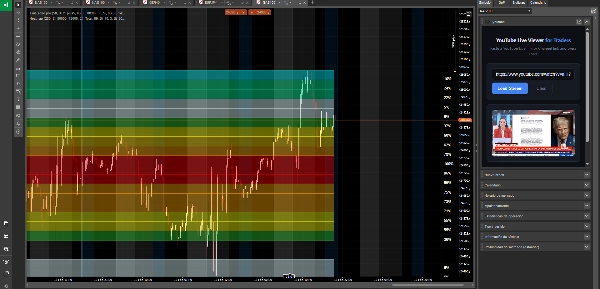
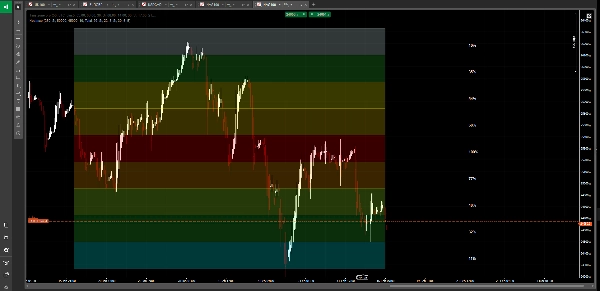
Sehen Sie den Markt wie nie zuvor mit dieser fortschrittlichen Volumen-Heatmap, die komplexe Volumendaten in eine intuitive visuelle Darstellung verwandelt. Im Gegensatz zu traditionellen Volumenindikatoren, die nur Balken am unteren Rand Ihres Charts anzeigen, zeigt Volume Heatmap Pro genau, wo institutionelle Händler Positionen auf jedem Preisniveau akkumulieren und verteilen.
HAUPTMERKMALE:
🔥 Dynamische, farbcodierte Heatmap
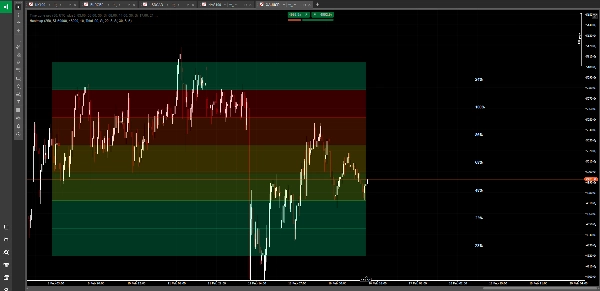
Erleben Sie Volumenanalyse durch ein beeindruckendes 10-stufiges Farbverlaufsystem. Von eisblau (minimale Aktivität) bis feuerrot (maximales Volumen) erkennen Sie sofort, wohin das große Geld fließt. Die Heatmap aktualisiert sich in Echtzeit und zeigt Ihnen die Marktdichte auf einen Blick.
📍 Point of Control (POC) Erkennung
Identifiziert und hebt automatisch das Preisniveau mit dem höchsten Handelsvolumen hervor – den wahren Gleichgewichtspunkt des Marktes. Hier haben Institutionen ihre größten Positionen aufgebaut und zu dem der Preis tendenziell zurückkehrt.
🎯 Mehrstufige Volumenverteilung
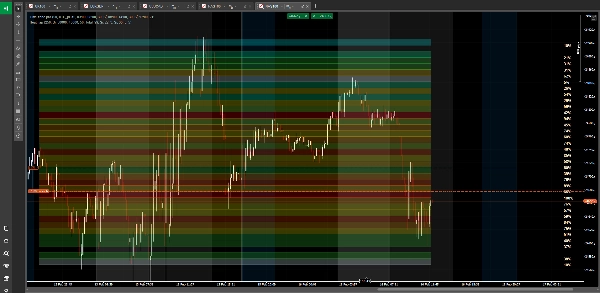
Teilt Ihren Preisbereich in bis zu 50 präzise Ebenen auf und erstellt eine detaillierte Karte der Volumenverteilung. Sehen Sie genau, welche Preise starken Handel anzogen und welche vom Markt ignoriert wurden.
📊 Drei Volumen-Analysemethoden
• Gesamtvolumen – Sehen Sie die gesamte Marktaktivität
• Nur Kaufvolumen – Isolieren Sie bullische Druckzonen
• Nur Verkaufsvolumen – Identifizieren Sie bärische Verteilungsbereiche
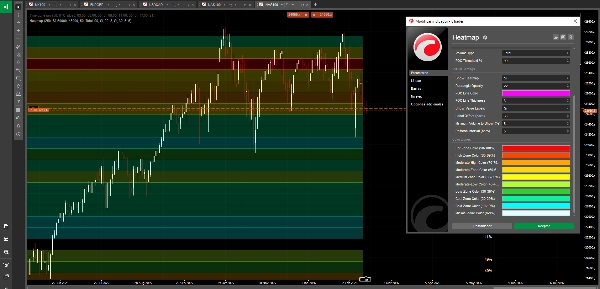
🎨 Professionelle Visualisierung
• Farbcodierte Rechtecke, die Ihren Analysezeitraum abdecken
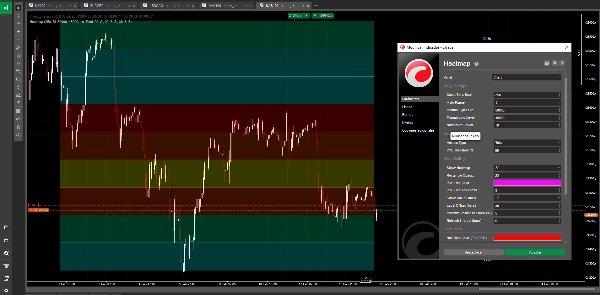
• Einstellbare Transparenz für perfekte Chart-Integration
• Optionale Volumen-Prozentangaben auf jeder Ebene
• Anpassbare POC-Linie mit Dickensteuerung
• Saubere, unaufdringliche Darstellung
⚙️ Intelligente Auto-Range-Technologie
Berechnet automatisch den optimalen Preisbereich basierend auf Ihrem Rückblickzeitraum oder definieren Sie manuell Ihren eigenen Bereich für spezifische Analysen. Die Heatmap passt sich jeder Marktbedingung oder jedem Zeitrahmen an.
🔄 Leistungsoptimiert
Konfigurierbare Aktualisierungsintervalle sorgen für eine flüssige Chart-Performance bei gleichzeitig genauer Volumenanalyse. Analysieren Sie bis zu 500 Balken zurück ohne Verzögerung.
📈 Anpassbare Farbzonen
Personalisieren Sie alle 10 Farbzonen, um Ihre visuellen Vorlieben anzupassen:
• Heiße Zone (90-100%) – Maximale Volumenkonzentration
• Hohe Zone (80-89%) – Starke Aktivität
• Moderat-Hoch (70-79%) – Überdurchschnittliches Volumen
• Moderat (60-69%) – Solide Aktivität
• Mittel (50-59%) – Durchschnittliches Volumen
• Moderat-Niedrig (40-49%) – Unterdurchschnittlich
• Niedrige Zone (30-39%) – Leichte Aktivität
• Kühle Zone (20-29%) – Minimaler Handel
• Kalte Zone (10-19%) – Sehr geringes Volumen
• Minimal (0-9%) – Fast keine Aktivität
PERFEKT FÜR:
• Identifikation institutioneller Akkumulations- und Distributionszonen
• Finden von Niedrigvolumen-Knoten für potenzielle Ausbruchsbereiche
• Erkennen von Hochvolumen-Unterstützungs- und Widerstandsniveaus
• Verständnis der Marktstruktur und Liquidität
• Bestätigung von Trade-Einstiegen in Hochvolumenbereichen
• Vermeidung von Niedrigliquiditäts-Fallen
• Multi-Timeframe-Volumenprofil-Analyse
WAS ES UNTERSCHIEDET:
Traditionelle Volumenindikatoren zeigen Ihnen, WIEVIEL gehandelt wurde, aber nicht WO. Volume Heatmap Pro zeigt das vollständige Bild – eine visuelle Dichtemap, die genau anzeigt, welche Preisniveaus die meiste Handelsaktivität absorbiert haben. Das Farbverlaufsystem macht komplexe Volumenanalysen so einfach wie das Lesen einer Wetterkarte. Rot bedeutet heiß (hohes Volumen), blau bedeutet kalt (geringes Volumen).
Egal, ob Sie Intraday-Reversals scalpen oder Positionen für Swing-Trades aufbauen, diese Heatmap zeigt Ihnen, wo der Markt echte Überzeugung hat und wo nur Rauschen ist.
---
⚠️ RISIKOHINWEIS:
Der Handel mit Devisen, Kryptowährungen und anderen Finanzinstrumenten birgt ein hohes Risiko und ist nicht für alle Anleger geeignet. Der hohe Hebel kann sowohl zu Ihrem Vorteil als auch zu Ihrem Nachteil wirken. Bevor Sie mit dem Handel beginnen, sollten Sie Ihre Anlageziele, Ihre Erfahrung und Ihre Risikobereitschaft sorgfältig abwägen. Es besteht die Möglichkeit, dass Sie einen Teil oder Ihr gesamtes Investment verlieren. Daher sollten Sie kein Geld investieren, dessen Verlust Sie sich nicht leisten können. Seien Sie sich aller Risiken des Handels bewusst und holen Sie bei Zweifeln Rat bei einem unabhängigen Finanzberater ein. Vergangene Leistungen sind kein Indikator für zukünftige Ergebnisse.
Zusammenfassung
Key features include automatic Point of Control (POC) detection, highlighting the price level with the highest trading volume, and multi-level volume distribution dividing the price range into up to 50 levels for detailed analysis. It supports three volume modes: total volume, buy volume only, and sell volume only, enabling users to isolate bullish or bearish pressure zones.
The indicator offers professional visualization with adjustable opacity, customizable color zones, optional volume percentage labels, and a customizable POC line. Smart auto-range technology calculates optimal price ranges based on the lookback period or manual input. Performance is optimized for smooth updates and analysis of up to 500 bars without lag.
Heatmap is suitable for identifying institutional accumulation and distribution zones, spotting support and resistance levels, understanding market structure, and conducting multi-timeframe volume profile analysis across markets including Forex, indices, and XAUUSD (gold).
Kundenbewertungen
5 | 67 % | |
4 | 33 % | |
3 | 0 % | |
2 | 0 % | |
1 | 0 % |


![„[Hamster-Coder] Pivot Points MTF“-Logo](https://cdn.ctrader.com/image/webp/4c143e5a-309c-40e3-a578-f04d1e133ffa_31159)


