
Beschreibung
https://chartshots.spotware.com/c/695bff3f3bc21
https://chartshots.spotware.com/c/695bffac03fb1
https://chartshots.spotware.com/c/695c0002aabb7
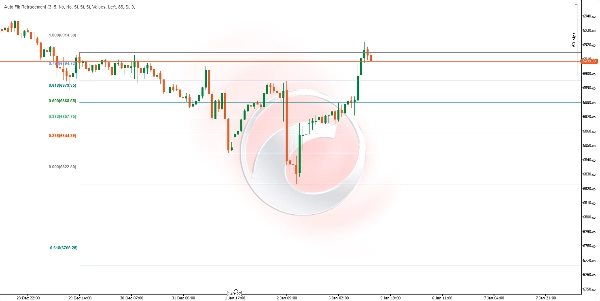
📊 Auto Fib Retracement
Auto Fib Retracement ist ein technischer Analyseindikator, der automatisch Fibonacci-Retracement- und Erweiterungsniveaus zeichnet basierend auf den jüngsten signifikanten Kursbewegungen. Im Gegensatz zu manuellen Fibonacci-Werkzeugen erkennt dieser Indikator Markt-Pivotpunkte automatisch und aktualisiert die Niveaus in Echtzeit.
⚙️ Wie funktioniert es?
Automatische Pivot-Erkennung
Der Indikator verwendet einen dynamischen ZigZag-Algorithmus, um signifikante Kurs-Hochs und -Tiefs zu identifizieren:
- Lookback (Tiefe): Definiert, wie viele Balken rückwärts analysiert werden, um einen Pivotpunkt zu bestätigen. Ein höherer Wert erkennt größere Schwankungen; ein niedrigerer Wert ist empfindlicher gegenüber kleineren Bewegungen.
- Empfindlichkeit (Abweichung): Steuert, wie signifikant eine Kursbewegung sein muss, um einen neuen Pivot zu bilden. Sie wird berechnet, indem der 10-Perioden-ATR (Average True Range) mit diesem Faktor multipliziert wird. Höhere Werte filtern Rauschen heraus und erkennen nur wichtige Bewegungen.
Berechnung der Fibonacci-Niveaus
Sobald die beiden letzten Pivots (ein Hoch und ein Tief) identifiziert sind, berechnet der Indikator jedes Niveau mit der klassischen Fibonacci-Formel:
Niveau = Ankerpreis + (Bewegungsbereich × Fibonacci-Verhältnis)
Dabei gilt:
- Ankerpreis: Der Preis des jüngsten Pivotpunkts (oder des vorherigen, wenn die Richtung sich umkehrt)
- Bewegungsbereich: Die Differenz zwischen den beiden Pivots
- Verfügbare Verhältnisse: 0, 0.236, 0.382, 0.5, 0.618, 0.65, 0.786, 1, 1.272, 1.414, 1.618, 1.65, 2.618, 2.65, 3.618, 3.65, 4.236, 4.618, und negative Niveaus (-0.236, -0.382, -0.618, -0.65)
📈 Wofür ist es?
UseDescription
Unterstützungs- und Widerstandsniveaus identifizieren
Niveaus 0.382, 0.5 und 0.618 sind klassische Zonen, in denen der Kurs typischerweise reagiert 🔵
Preisziele definieren
Erweiterungsniveaus (1.618, 2.618, 3.618, 4.236) helfen dabei abzuschätzen, wie weit eine Bewegung gehen könnte 🎯
Einstiege planen
Suchen Sie nach Rücksetzern zu Schlüssel-Niveaus, um in Trendrichtung einzusteigen ⬆️⬇️
Stop-Loss setzen
Platzieren Sie Stops jenseits relevanter Fibonacci-Niveaus 🛑
Umkehrzonen bestätigen
Wenn der Kurs extreme Erweiterungsniveaus erreicht, kann dies auf Erschöpfung hinweisen 🔄
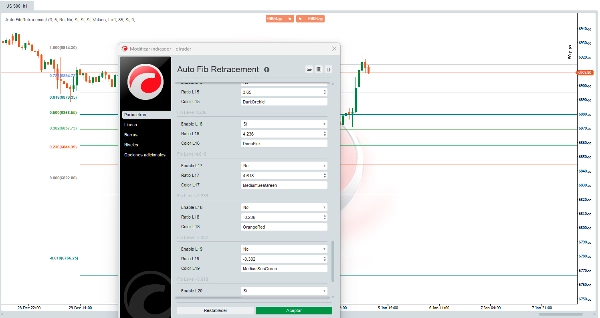
🛠️ Wie man es benutzt
Hauptparameter
ParameterBeschreibungEmpfohlener Wert
Empfindlichkeit
Abweichungs-Multiplikator zur Filterung kleiner Bewegungen
3 (Standard)
Lookback
Minimale Anzahl von Balken zur Berechnung der Pivots
10 (Standard)
Richtung umkehren
Kehrt den Referenzpunkt für die Niveau-Berechnung um
Deaktiviert
Anzeigeoptionen
OptionFunktion
Links / Rechts erweitern
Erweitert horizontale Linien nach links oder rechts im Chart
Preise anzeigen
Zeigt den genauen Preis jedes Niveaus an
Verhältnisse anzeigen
Zeigt das Fibonacci-Verhältnis (Werte oder Prozentsatz)
Position der Beschriftung
Positioniert Labels links oder rechts
Zonen-Transparenz
Steuert die Transparenz der farbigen Zonen zwischen den Niveaus
Konfigurierbare Fibonacci-Niveaus
Jedes der 22 Niveaus kann:
- Einzeln aktiviert oder deaktiviert werden
- Seinen numerischen Wert geändert bekommen
- Seine Farbe geändert bekommen
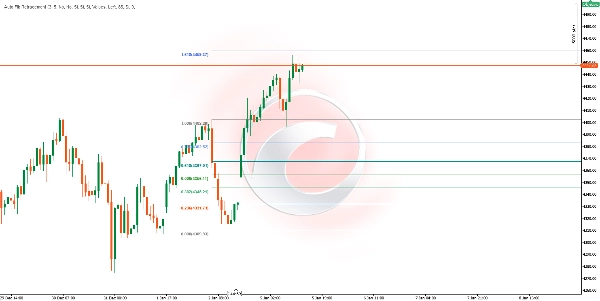
💡 Interpretation der Zonen
Farbige Zonen zwischen aufeinanderfolgenden Niveaus erleichtern die visuelle Identifikation:
- Grün/Blaue Zonen (0.382 - 0.786): Bereich eines gesunden Rücksetzers in Trends. Häufige Zone für Einstiege. ✅
- Zone bei Niveau 1.0: Repräsentiert 100 % der vorherigen Bewegung. Dient als wichtiger Unterstützungs-/Widerstandspunkt. ⚖️
- Rot/Rosa Zonen (1.618+): Erweiterungen der Bewegung. Das Erreichen dieser Zonen kann auf Überdehnung hinweisen. ⚠️
⚠️Überlegungen
- Der Indikator aktualisiert sich automatisch wenn neue signifikante Pivots erkannt werden
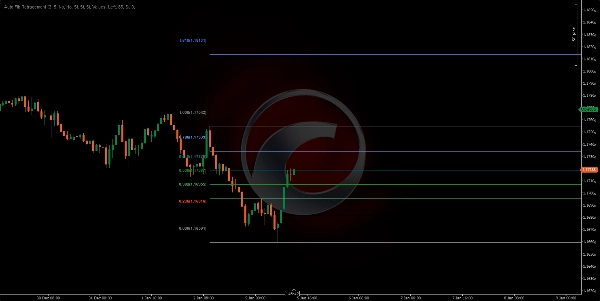
- Er funktioniert auf jedem Zeitrahmen und Finanzinstrument
- Fibonacci-Niveaus sind Wahrscheinlichkeitszonen, keine Garantien
- Empfohlen wird die Nutzung in Kombination mit anderen Indikatoren oder der Kursanalyse
- In Seitwärts- oder unruhigen Märkten können sich Pivots häufig ändern
📝 Technische Hinweise
- Der 10-Perioden-ATR wird intern verwendet, um die dynamische Schwelle für die Pivot-Erkennung zu berechnen
- Der Indikator benötigt eine minimale historische Datenmenge, die dem Doppelten des Lookback-Parameters entspricht um korrekt zu funktionieren
- Linien und Zonen werden nur am letzten Balken neu gezeichnet zur Optimierung der Leistung 🚀
Zusammenfassung
The indicator helps traders identify potential support and resistance zones, define price targets, plan entries on pullbacks, set stop-losses beyond key levels, and confirm reversal zones when price reaches extreme extensions. It works on any timeframe and financial asset, including Forex, stocks, commodities, indices, and cryptocurrencies such as BTCUSD, EURUSD, GBPUSD, XAUUSD, NAS100, and others.
Users can customize parameters like sensitivity, lookback period, direction inversion, and display options (line extension, price and ratio labels, zone opacity, and colors). Colored zones visually highlight key Fibonacci areas for easier interpretation. The indicator updates automatically with new pivots and redraws levels on the latest bar to optimize performance.


