
Descripción
Si el mercado sigue moviéndose en esta nueva dirección, en algún momento la ganancia de la operación en dirección opuesta superará la pérdida de la operación inicial, momento en el cual puedes cerrar ambas operaciones.
Si el mercado vuelve a la dirección anterior, la operación opuesta con el tamaño de lote mayor acumulará pérdidas más rápido de lo que la operación inicial está ganando. En esta situación, abrimos otra operación en la dirección inicial por lo que la operación inicial y la tercera operación juntas serán mayores que la segunda operación.
Esta estrategia de cobertura de ida y vuelta puede continuar hasta que la acción del precio rompa en cualquiera de las dos direcciones.
Cómo usar el Indicador de Recuperación de Zona
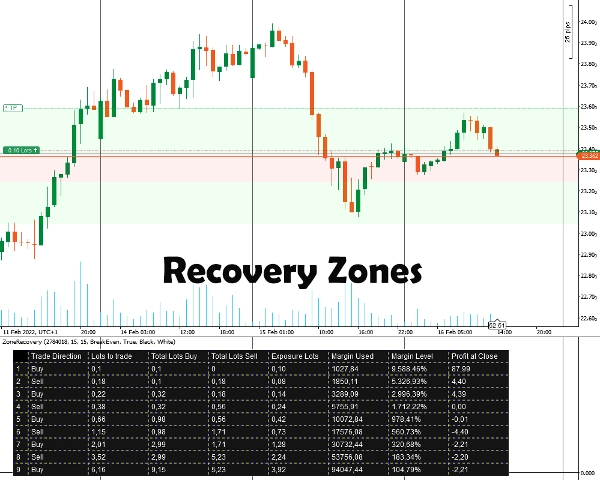
Primero, debes ingresar el ID de la Posición para la que deseas cubrirte. La posición debe tener un objetivo de ganancia. Después de eso, seleccionas el tamaño de Recuperación de Zona ingresando el número de pips a partir del cual crees que debes comenzar a cubrirte. El indicador mostrará las zonas así como la tabla para que la estrategia funcione.
Tendrás que colocar manualmente las órdenes, el stop loss y los objetivos de toma de ganancias para todas las posiciones subsecuentes.
Información Importante
Primero y ante todo, tu cuenta de trading debe ser una cuenta de tipo cobertura.
- En esencia, esta es una estrategia martingala que conlleva sus riesgos. Si la operación inicial se abre en un mercado lateral, esto puede agotar rápidamente tu margen. Necesitas instrumentos volátiles/tendenciales para mejores resultados.
- Los instrumentos de trading con bajas comisiones/spreads pequeños funcionarán mejor.
- Si la operación inicial se realiza con el tamaño mínimo de lote, los cálculos subsecuentes serán marginalmente incorrectos, debido a cálculos erróneos de comisiones y tamaños de lote redondeados hacia arriba/abajo para operaciones futuras.
- Si operas un instrumento que es diferente de la moneda de tu cuenta, el cálculo del margen será ligeramente incorrecto debido a que las tasas de cambio cambian constantemente. (Por ejemplo, cuenta en EUR, posición abierta en GBP/USD)
- Los swaps no se toman en consideración.
Opciones del Indicador
El indicador ofrece las siguientes opciones:
- ID de Posición - El ID de la posición abierta para la que deseas calcular la tabla de cobertura. Puede ingresarse sin el “PID” inicial (solo los números).
- Pips de Recuperación de Zona - El número de pips que la recuperación de zona tomará en cuenta para los cálculos. Al final de la recuperación de zona, deben abrirse las operaciones en dirección opuesta a la operación inicial.
- Modo de Cálculo
Dos modos están disponibles: BreakEven y Ganancia
BreakEven: Los cálculos intentarán darte tamaños de lote para tener pérdidas cero o mínimas cuando todas las operaciones se cierren. Drenaje de margen más lento.
Ganancia: Los cálculos intentarán darte tamaños de lote para alcanzar el objetivo de ganancia de la operación inicial abierta. Drenaje de margen más rápido. - Dibujar Áreas de Recuperación de Zona - Elige sí si deseas que las áreas de Recuperación de Zona se dibujen en el Gráfico.
- Color de Tabla / Color de Fuente - Opciones de color para la tabla de cobertura.
Resumen
Valoraciones de clientes
5 | 100 % | |
4 | 0 % | |
3 | 0 % | |
2 | 0 % | |
1 | 0 % |


