
Price Level DWM BT
Indikator
Versi 1.0, Dec 2025
Windows, Mac
4.7
Ulasan: 4
Penerangan
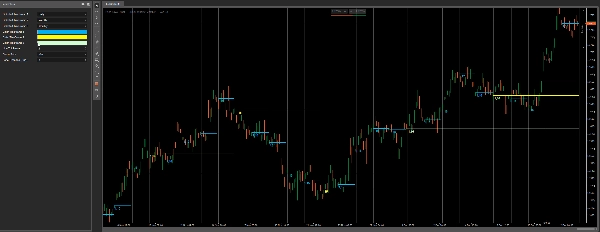
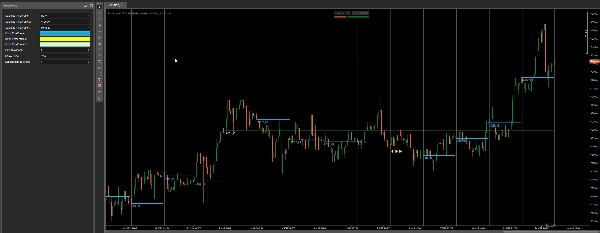
Tahap Harga DWM oleh Bullitt Traders
Tahap Harga DWM Harian Mingguan Bulanan Tahap Perubahan Harga memplot tahap rujukan jangka masa lebih tinggi dengan bersih terus ke carta anda — jadi anda sentiasa tahu di mana harga berdiri berbanding penanda aras Harian, Mingguan dan Bulanan utama.
Tahap ini digunakan secara meluas untuk:
- konteks bias & arah
- reaksi sokongan/rintangan intrahari
- keputusan pembalikan purata vs. kesinambungan
- “perdagangan lokasi” (di mana harga berdagang berbanding jangka masa lebih tinggi)
Pastikan carta anda minimal, pantas dan boleh dibaca sambil masih mempunyai konteks HTF dalam pandangan.
Apa yang anda dapat
- Sehingga 3 tahap rujukan jangka masa lebih tinggi pada masa yang sama
- Harian / Mingguan / Bulanan boleh dipilih melalui dropdown
- Warna berasingan bagi setiap jangka masa
- Ketebalan boleh laras
- Label harga pilihan (bersih dan tidak mengganggu)
Ciri Utama
- Plot tahap HTF minimalis (direka untuk carta yang bersih)
- Tahap rujukan yang tidak dicat semula (berdasarkan data HTF yang lengkap)
- Berfungsi dengan baik dengan sesi, zon S&D, struktur pasaran, alat ICT dan banyak lagi
- Sesuai untuk FX, indeks, emas — mana-mana pasaran
Tetapan
- Pilih Jangka Masa 1 / 2 / 3
- Warna bagi setiap jangka masa
- Ketebalan garis
- Tunjukkan label harga (hidup/mati)
- Jarak label (offset visual)
Nota
- Menggunakan data jangka masa lebih tinggi yang lengkap untuk memastikan tahap stabil dan konsisten.
Ringkasan
Profil indikator
Kategori indikator
Kemeruapan
Jenis output
Isyarat
Keperluan data
Data luaran
Isyarat yang disokong
Pecahan paras
Ulasan pelanggan
4.7
Ulasan: 4
5 | 75 % | |
4 | 25 % | |
3 | 0 % | |
2 | 0 % | |
1 | 0 % |
Ulasan pelanggan
February 9, 2026
Price Level DWM BT provides clean and accurate daily, weekly and monthly levels. Best used from M5 and higher timeframes, where levels stay readable and meaningful. A great context tool for intraday and swing traders who rely on higher-TF structure, reactions and trade planning.
December 18, 2025
The setup needs less second guessing, but overconfidence is the real danger.
December 15, 2025
pretty fine as one more layer, especially in mixed charts. A few signals across sessions tell more.
Perbincangan
Soalan Lazim
Prop
Forex
Signal
Breakout
Scalping
Commodities
Crypto
Produk yang tersedia melalui cTrader Store, termasuk bot dagangan, indikator dan plugin, disediakan oleh pembangun pihak ketiga dan diberikan akses untuk tujuan maklumat dan teknikal sahaja. cTrader Store bukan broker dan tidak memberikan nasihat pelaburan, syor peribadi atau sebarang jaminan prestasi masa hadapan.


Harga
48
Jualan
1.05K
Pemasangan percuma