present
Daftar dan dapatkan potongan bernilai $50 untuk pembelian pertama anda
Trading product for DXY Valuation Zones 1.0 BT Indikator Prop Forex, image 1
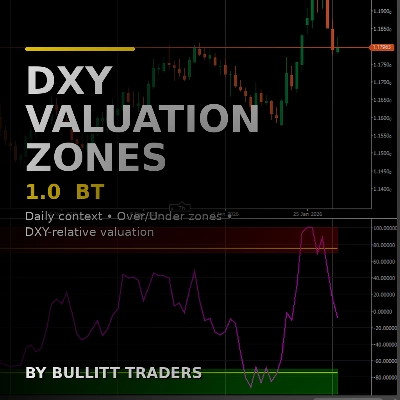
DXY Valuation Zones 1.0 BT
Indikator
Versi 1.0, Feb 2026
Windows, Mac
4.5
Ulasan: 4
Trading product for DXY Valuation Zones 1.0 BT Indikator Prop Forex, image 2
Trading product for DXY Valuation Zones 1.0 BT Indikator Prop Forex, image 3
51
Jualan
1.46K
Pemasangan percuma

Penerangan

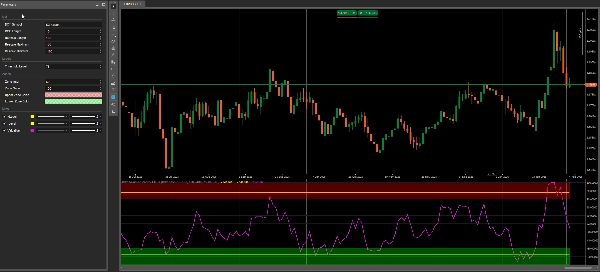
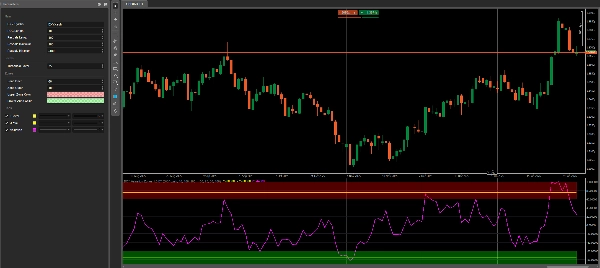
DXY Valuation Zones 1.0 BT menunjukkan garis penilaian relatif DXY yang jelas untuk simbol carta anda dan menyerlahkan dua kawasan konteks mudah: Zon Lebihan dan Zon Kekurangan.
Ia dibina sebagai penapis konteks Harian (D1) — tiada kekacauan, hanya zon yang jelas + tahap ±Ambang yang boleh dikonfigurasikan.

Semua warna zon menggunakan pemilih warna cTrader asli, jadi anda boleh mengawal ketelusan secara langsung melalui peluncur kelegapan dalam palet.

Penggunaan Disyorkan (Terbaik pada Harian)

Penunjuk ini berfungsi terbaik pada pasangan berkaitan USD, kerana DXY mewakili kekuatan USD yang meluas.

Contoh:

  • XXXUSD: EURUSD, GBPUSD, AUDUSD, NZDUSD
  • USDXXX: USDJPY, USDCAD, USDCHF

Mula Cepat (default disyorkan)

  • Jangka Masa: Harian (D1)
  • Zon Lebihan: +70 … +100
  • Zon Kekurangan: -70 … -100
  • Ambang: ±75 (boleh laras)
  • Simbol DXY: DXY.cash (atau nama DXY broker anda)


Cara ia berfungsi (mudah)

  1. Mengira ROC (perubahan peratus) untuk simbol carta anda
  2. Mengira ROC yang sama untuk DXY
  3. Menggunakan perbezaan (ROC Simbol – ROC DXY)
  4. Mengubah skala hasil ke julat stabil -100 … +100


Cara membacanya

  • Penilaian > +Ambang → konteks regangan / “Lebihan”
  • Penilaian < -Ambang → konteks regangan / “Kekurangan”
  • Di antara → konteks neutral

Gunakan ia sebagai penapis bias & lokasi, bukan sebagai isyarat masuk berdiri sendiri.


Penting (Keperluan Broker)

Penunjuk ini memerlukan simbol DXY yang disediakan oleh broker (contoh: DXY.cash).
✅ Telah diuji pada FTMO (ketersediaan dan penamaan mungkin berbeza mengikut feed broker).
Jika broker anda menggunakan nama yang berbeza, hanya tukar Simbol DXY pa

Ringkasan

Ringkasan AI
DXY Valuation Zones 1.0 BT is a daily timeframe indicator designed to provide a clear DXY-relative valuation line for any chart symbol. It highlights two key context areas: an Over Zone (+70 to +100) and an Under Zone (-70 to -100), with a configurable ±Threshold level (default ±75). The indicator calculates the rate of change (ROC) for both the selected symbol and the DXY (US Dollar Index), then uses their difference to produce a rescaled valuation value within a -100 to +100 range.

This tool is optimized for USD-related currency pairs, such as EURUSD, GBPUSD, AUDUSD, NZDUSD, USDJPY, USDCAD, and USDCHF, reflecting broad USD strength via the DXY. Zone colors are customizable using the native cTrader color picker, including transparency adjustments.

Traders can interpret values above the positive threshold as an "Over" or stretched context, values below the negative threshold as an "Under" context, and values in between as neutral. The indicator serves as a bias and location filter rather than a standalone entry signal. It requires a broker-provided DXY symbol (e.g., DXY.cash) to function properly.
Profil indikator

Perbincangan

Ulasan pelanggan

4.5
Ulasan: 4
5
50 %
4
50 %
3
0 %
2
0 %
1
0 %
Ulasan pelanggan
February 10, 2026
The cleanest use is messy areas become easier to avoid. It works better with a written plan.
February 9, 2026
The decision feels less rushed, but the market context still matters.
February 8, 2026
spread and slippage need a line in the notes, and it keeps the review from getting sloppy.
February 6, 2026
Tested small first and that felt like the right move, and Half size is enough at the start.

Soalan Lazim

Prop
Forex
Signal
Produk yang tersedia melalui cTrader Store, termasuk bot dagangan, indikator dan plugin, disediakan oleh pembangun pihak ketiga dan diberikan akses untuk tujuan maklumat dan teknikal sahaja. cTrader Store bukan broker dan tidak memberikan nasihat pelaburan, syor peribadi atau sebarang jaminan prestasi masa hadapan.

Lebih banyak produk daripada penulis ini

Indikator
Forex
Signal
Market Session BT
Indikator
Prop
Forex
+5
Half Trend – Trend Reversal Indicator for cTrader
Indikator
Prop
Forex
+4
Camarilla — a precise, non-repainting pivot indicator for cTrader.
Indikator
Prop
Forex
+12
Half Trend Cloud
Indikator
Prop
Forex
+4
Bar Time Timeframe / Renko
Indikator
Prop
Forex
+4
HMA MTF 2.0 (Multi-Timeframe )
Indikator
Forex
BTCUSD
+10
Belkhayate PRC (Polynomial Regression Channel)
Indikator
Prop
Forex
+3
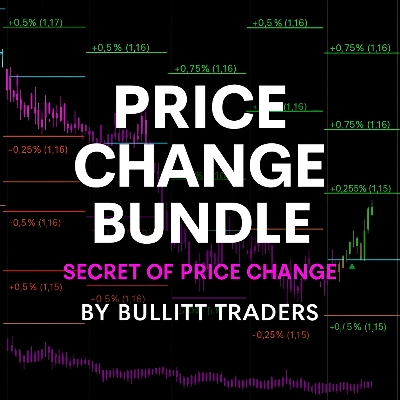
Price Change Bundle 3-in-1 Levels • Bars • Histogram. Secret of Price Change
Indikator
SMA
Market Structure
ICT Power of 3 AMD
Indikator
Key Levels
Supply & Demand
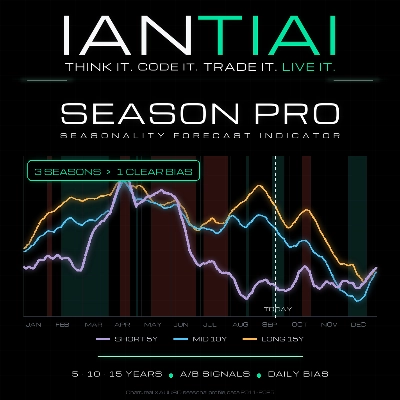
IANTIAI Season Pro – know when the market usually moves
Indikator
Prop
Forex
+5
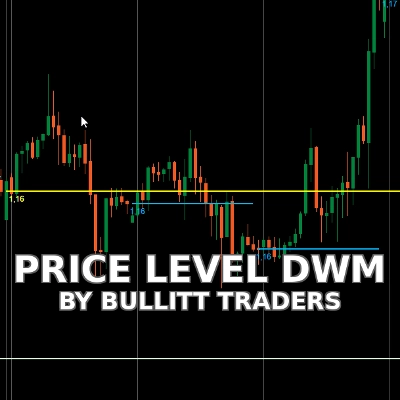
Price Level DWM BT
cBot
AI Trading
AI Integration
Export cTrader market data to CSV or JSON for Python, AI, backtesting and quantitative research.

Anda juga mungkin suka

Indikator
EMA
AI-assisted
+1
Multi EMA Timeframes lets you stay on your chart and see the exact EMA from any timeframe you choose — up to 5 at once.
Indikator
Forex
Crypto
+3
Consecutive Series Moves — Reveal the True Pulse of Price Action
Indikator
The Advanced Volume Profile Indicator calculates POC, Median, and Mode, revealing key price levels for smarter trading.
Indikator
SMC
Prop
+4
📈 Trading Sessions Indicator — London, New York & Tokyo Visualize Key Market Sessions + High/Low Levels with Precision
Indikator
Prop
Forex
+11
Customize your Moving Average! Choose any timeframe and price source for precision and flexibility in your analysis.
Indikator
SmartFibonacci — automatic Fibonacci retracements & extensions with swing detection, alerts and clean labels for cTrader
Indikator
SMC
Prop
+16
Multi-Time Frame Candlesticks FVG with BSL/SSL Premium Suite
Indikator
RSI
MACD
+1
Precision Supply & Demand zones indicator—automatically plots key buy/sell areas on your chart for smarter entries.
Indikator
Volume
Support & Resistance
Compare up to 27 symbols across eight timeframes with seven analysis engines and an interactive cTrader dashboard.
Indikator
ATR
SMC
+15
Plot ATR-based SL and 1R/2R/3R TPs instantly for any trade, with clear R-multiple risk mapping.
Indikator
SMC
VWAP
+16
It calculates Anchored VWAP and StdDev bands from a user-defined start date for cTrader charts.
Indikator
ATR
Forex
+5
🚀 Buy and sell signals 📈📉 only when three independent engines agree simultaneously.
Indikator
Supertrend
Moving Average
Easy Trade: Trend & Breakout Indicator for cTrader
Indikator
ATR
BOS
+5
Market structure with BOS and CHoCH, order blocks, and retest buy/sell arrows with entry, stop and two targets
Indikator
ATR
Market Structure
+3
Support Resistance Toolkit
Indikator
ATR
Volume
+2
Nine timeframe cards, vivid candles, native BUY/SELL arrows and adjustable ATR-buffer stop-loss reference lines.
Indikator
Aggressive
Supertrend
+5
Stop trading with tunnel vision! 🚫 The Heat Map Dashboard is an institutional-grade visual trading assistant
Indikator
ATR
RSI
+19
Multi-timeframe heatmap scoring Direction, Strength & Volatility at a glance!

Harga

51
Jualan
1.46K
Pemasangan percuma