Penerangan
Belkhayate PRC (Saluran Regresi Polinomial)
1 lengkung. 3 jalur sisihan. Struktur bersih.
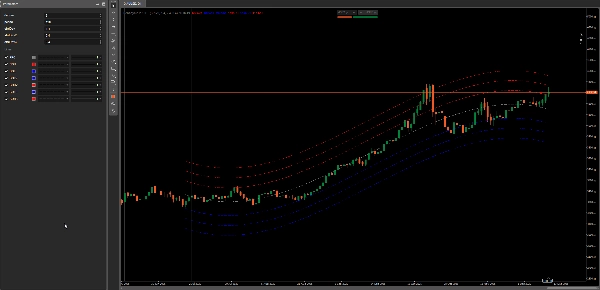
Belkhayate PRC adalah Saluran Regresi Polinomial dengan 3 sampul sisihan piawai.
Ia membantu anda mengenal pasti zon min, pengembangan, dan keletihan dengan cara yang mudah: harga cenderung berayun di sekitar lengkung regresi yang lancar — dan jalur luar sering bertindak seperti kawasan reaksi praktikal.
Keluaran ini adalah percuma, kerana saya mahu setiap pedagang dapat mengujinya, memahaminya, dan memutuskan jika ia sesuai dengan aliran kerja mereka.
Apa yang ia lakukan
Lengkung Regresi Polinomial (PRC)
- Memadankan lengkung regresi yang lancar kepada N bar terakhir (Tempoh anda).
- Darjah 1–4: dari pelicinan lembut ke kelengkungan yang lebih kuat.
Jalur Sisihan (3 tahap)
- 3 sampul berdasarkan ralat regresi (sisihan piawai).
- Berguna sebagai “zon” untuk penarikan balik, ekstrem, dan keadaan pembalikan min.
Mengapa ia berguna
- Kejelasan tren tanpa penumpukan MA yang lambat
PRC memberikan anda “pusat graviti” yang bersih untuk Tempoh terakhir. - Ekstrem yang tersusun
Jalur membantu anda menilai bila harga meregang berbanding bila ia kembali ke wilayah normal. - Hebat untuk konteks + pelaksanaan
Gunakan TF yang lebih tinggi untuk arah/konteks dan TF yang lebih rendah untuk kemasukan ke lengkung atau zon jalur.
Sejarah / dari mana idea ini datang
Alat ini diilhamkan oleh konsep klasik saluran regresi yang digunakan dalam analisis teknikal (memadankan garis/lengkung regresi kepada harga dan membina sampul berdasarkan sisihan).
Nama “Belkhayate” biasanya dikaitkan dengan versi popular saluran gaya PRC ini yang dikongsi dalam komuniti perdagangan.
Pelaksanaan cTrader saya adalah pembinaan semula yang bersih, fokus pada kestabilan, tetapan, dan kegunaan praktikal pada carta moden.
Penggunaan yang disyorkan
- Pasaran tren: berdagang penarikan balik ke arah PRC, urus risiko menggunakan jalur terdekat
- Pasaran julat: mengurangkan ekstrem (jalur 2 / jalur 3) kembali ke arah PRC
- Semakan volatiliti: jalur melebar = volatiliti berkembang / pecutan
Ringkasan
This indicator helps traders identify mean zones, expansion phases, and exhaustion points by showing how price oscillates around the regression curve, with outer bands often acting as reaction areas. It is applicable across various markets including Forex, indices, commodities, stocks, and cryptocurrencies, supporting symbols like BTCUSD, EURUSD, GBPUSD, XAUUSD, NAS100, and USDJPY.
Recommended uses include trading pullbacks toward the PRC in trending markets, fading extremes in ranging markets, and monitoring volatility through band width changes. The tool is designed for clarity and practical usability on modern charts, suitable for combining higher timeframes for context with lower timeframes for execution.
Ulasan pelanggan
5 | 100 % | |
4 | 0 % | |
3 | 0 % | |
2 | 0 % | |
1 | 0 % |


![Logo "[Hamster-Coder] Moving Average MTF"](https://cdn.ctrader.com/image/webp/b11b98b1-194d-4b8e-b00e-d611826ad159_31226)