📈 Stochastic RSI
Penunjuk Stochastic RSI adalah osilator momentum yang menggunakan formula Stochastic pada nilai RSI dan bukannya harga, menjadikannya penunjuk derivatif kedua. Ia sangat berguna untuk mengenal pasti keadaan terlebih beli dan terlebih jual dengan kepekaan yang lebih tinggi berbanding RSI standard.
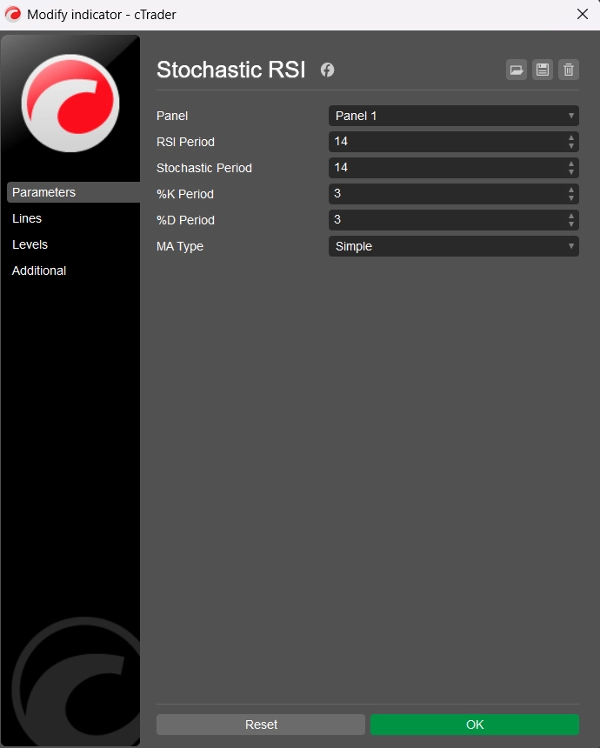
🛠️ Parameter
Tempoh RSI: Tempoh semakan yang digunakan untuk mengira RSI asas (lalai = 14)
Tempoh Stochastic: Tempoh semakan yang digunakan pada nilai RSI untuk mengira Stochastic RSI (lalai = 14)
Tempoh %K: Tempoh pelicinan untuk garis %K (lalai = 3)
Tempoh %D: Tempoh pelicinan untuk garis %D (lalai = 3)
Jenis MA: Jenis purata bergerak untuk pelicinan: Mudah atau Eksponen (lalai = Mudah)
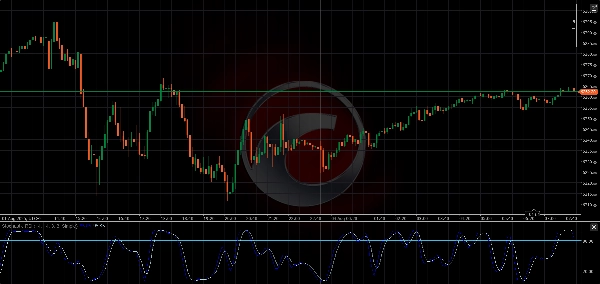
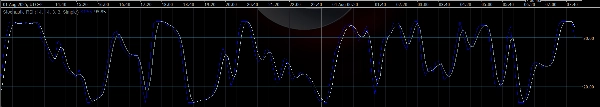
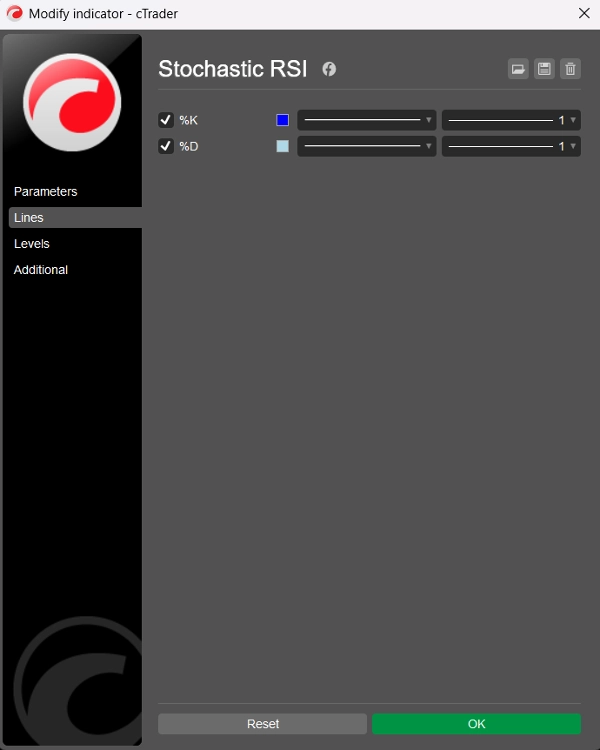
📊 Garis Output
- Garis %K: Stochastic RSI yang dipelincirkan (biru)
- Garis %D: Purata bergerak pelincir bagi %K (biru muda)
Kedua-dua garis berayun antara 0 dan 100, membolehkan bacaan terlebih beli dan terlebih jual yang jelas.
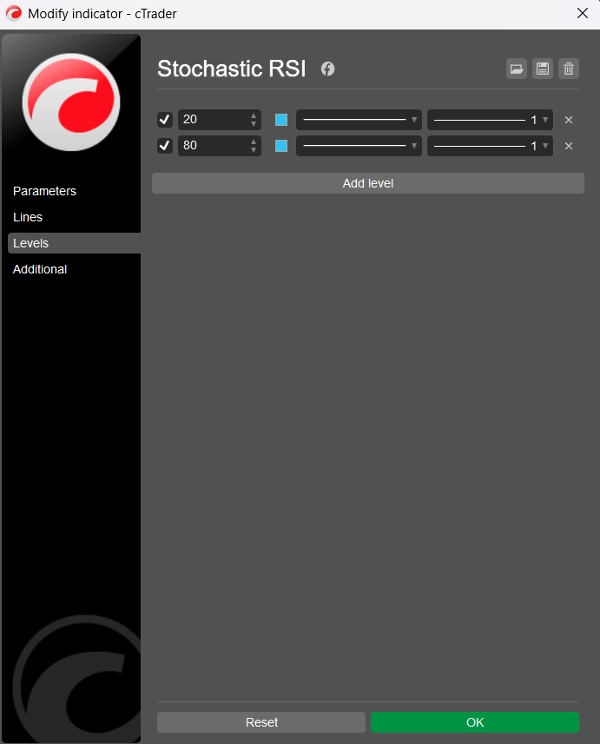
⚠️ Tahap Dicadangkan
Walaupun penunjuk tidak memaparkan tahap statik secara lalai, pengguna disarankan untuk menambah secara manual melalui tab “Levels” dalam cTrader:
- Tahap 80 → Terlebih Beli
- Tahap 20 → Terlebih Jual
Tahap ini berfungsi serupa dengan Osilator Stochastic tradisional tetapi digunakan pada tingkah laku RSI, menjadikan isyarat lebih tajam dan sering lebih pantas.
🧠 Cara Menggunakan
- Terlebih Beli (>80): Mungkin menunjukkan harga terlalu tinggi — potensi pembalikan atau pengukuhan.
- Terlebih Jual (<20): Mungkin menandakan harga terlebih jual — kemungkinan pantulan atau pembalikan tren.
- Persilangan %K dan %D: Boleh digunakan serupa dengan Stochastic atau MACD — persilangan bullish di bawah 20 atau persilangan bearish di atas 80 mungkin boleh diambil tindakan.
🏷️ Nota
- Dibina untuk cTrader menggunakan C# dan Automate API
- Bersih, cekap, dan boleh disesuaikan dengan dua jenis MA
- Kod dan logik oleh BlueRocketBots & ChatGPT (OpenAI)
- Kod bersih (jumlah 109 baris; 60 baris kod, 29 baris teks, 20 baris kosong)
- Percuma!