الوصف
📈 مؤشر القوة النسبية العشوائي
مؤشر مؤشر القوة النسبية العشوائي هو مذبذب زخم يطبق صيغة العشوائي على قيم مؤشر القوة النسبية بدلاً من السعر، مما يجعله مؤشر مشتق ثانٍ. وهو مفيد بشكل خاص لتحديد حالات الشراء المفرط والبيع المفرط بحساسية أعلى من مؤشر القوة النسبية القياسي.
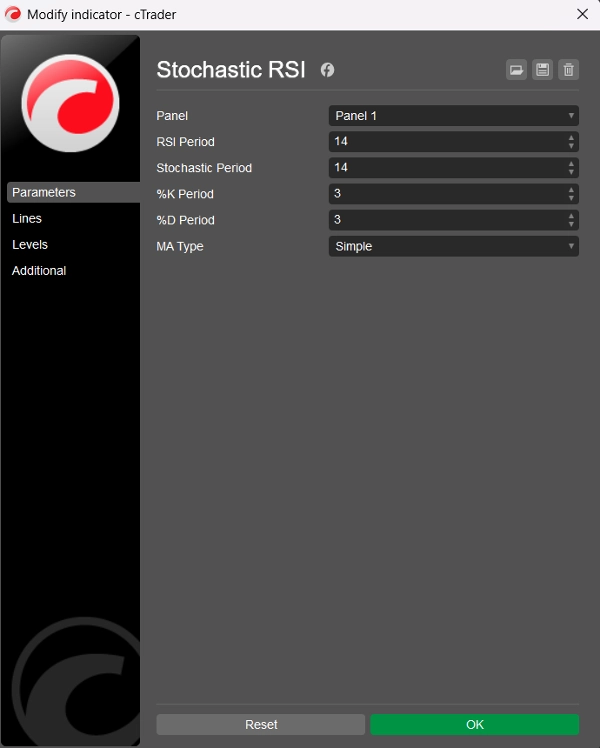
🛠️ المعلمات
فترة مؤشر القوة النسبية: فترة النظر للخلف المستخدمة لحساب مؤشر القوة النسبية الأساسي (الافتراضي = 14)
الفترة العشوائية: فترة النظر للخلف المطبقة على قيم مؤشر القوة النسبية لحساب مؤشر القوة النسبية العشوائي (الافتراضي = 14)
فترة %K: فترة التنعيم لخط %K (الافتراضي = 3)
فترة %D: فترة التنعيم لخط %D (الافتراضي = 3)
نوع المتوسط المتحرك: نوع المتوسط المتحرك للتنعيم: اختيار من 11 نوعًا (الافتراضي = بسيط)
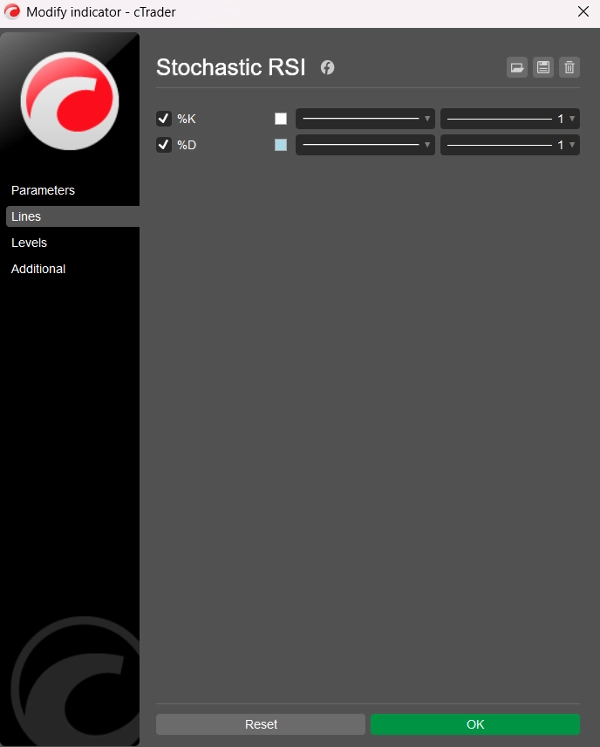
📊 خطوط الإخراج
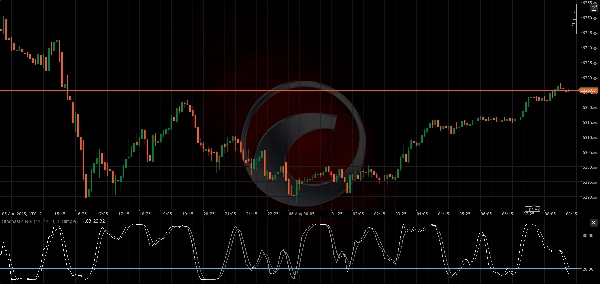
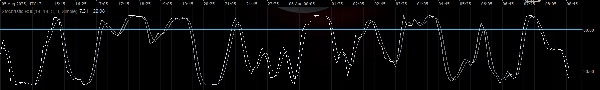
- خط %K: مؤشر القوة النسبية العشوائي المملس (أبيض)
- خط %D: المتوسط المتحرك المملس لخط %K (أزرق فاتح)
كلا الخطين يتأرجحان بين 0 و 100، مما يسمح بقراءات واضحة للشراء المفرط والبيع المفرط.
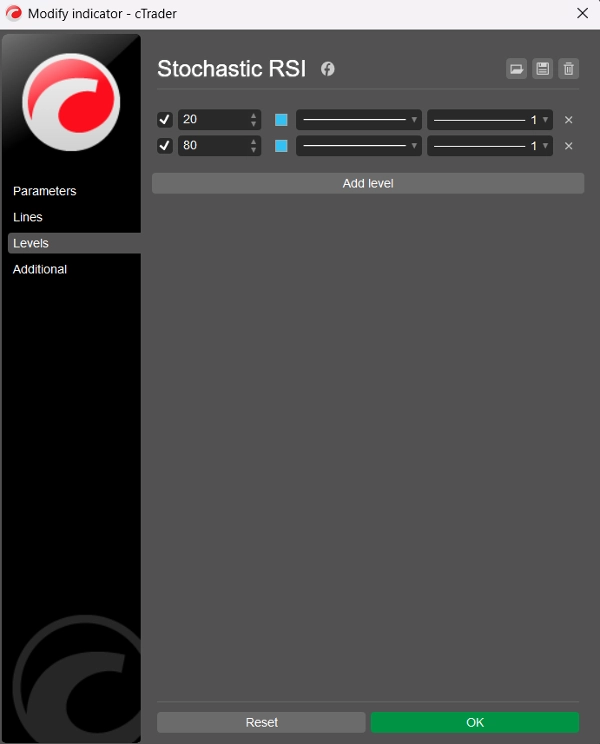
⚠️ المستويات المقترحة
على الرغم من أن المؤشر لا يعرض مستويات ثابتة بشكل افتراضي، يُنصح المستخدمون بإضافة هذه يدويًا عبر تبويب "المستويات" في cTrader:
- المستوى 80 → شراء مفرط
- المستوى 20 → بيع مفرط
تعمل هذه المستويات بشكل مشابه لمذبذب العشوائي التقليدي ولكن مطبقة على سلوك مؤشر القوة النسبية، مما يجعل الإشارات أكثر حدة وغالبًا أسرع.
🧠 كيفية الاستخدام
- شراء مفرط (>80): قد يشير إلى أن السعر مفرط في الصعود — احتمال حدوث انعكاس أو تماسك.
- بيع مفرط (<20): قد يشير إلى أن السعر مفرط في الهبوط — احتمال حدوث ارتداد أو انعكاس اتجاه.
- تقاطع %K و %D: يمكن استخدامها بشكل مشابه للعشوائي أو MACD — تقاطع صعودي تحت 20 أو تقاطع هبوطي فوق 80 قد يكون قابلًا للتنفيذ.
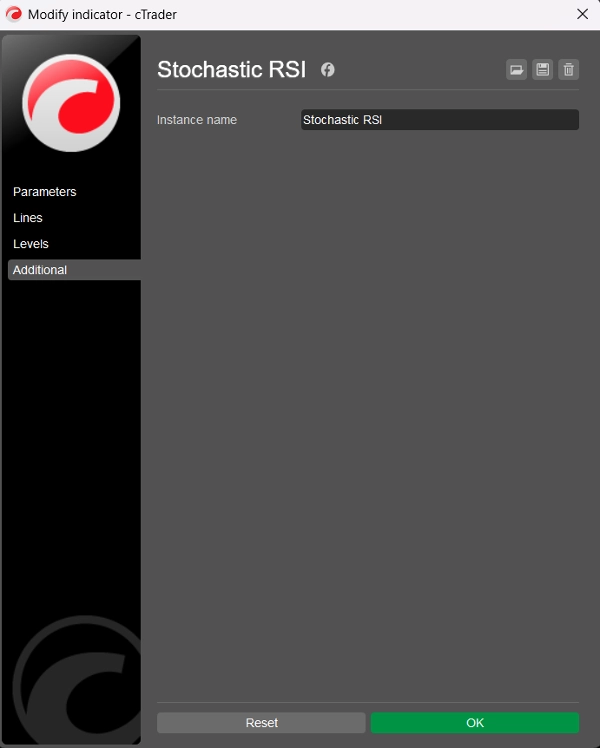
🏷️ ملاحظات
- مصمم لـ cTrader باستخدام C# وواجهة برمجة التطبيقات Automate
- نظيف وفعال وقابل للتخصيص مع 11 نوعًا من المتوسطات المتحركة
- الرمز والمنطق من BlueRocketBots و ChatGPT (OpenAI)
- رمز نظيف (إجمالي 99 سطرًا؛ 54 سطرًا رمز، 27 سطرًا نص، 18 سطرًا فارغ)
- نسخة محسنة V2
- مجانًا!
الملخص
Key parameters include the RSI Period (default 14), Stochastic Period (default 14), %K and %D smoothing periods (default 3 each), and a choice among 11 moving average types for smoothing (default is Simple). The indicator outputs two lines: the %K line (smoothed Stochastic RSI) and the %D line (smoothed moving average of %K), both oscillating between 0 and 100.
Suggested manual levels for interpretation are 80 (overbought) and 20 (oversold). Traders may use these levels along with %K and %D crossovers to identify potential price reversals or consolidations. For example, a bullish crossover below 20 or a bearish crossover above 80 can signal actionable market moves.
The indicator is implemented in clean, efficient C# code using the Automate API, allowing customization and integration within cTrader.