
ZigZag Price Liquidity Projection
指标
355 下载
版本 1.0, Jul 2025
Windows 版、Mac 版
说明
Pinescriptlabs 商店指标: Pinescriptlabs 商店 cBots : (cBot) Gold & BTC 突破会话枢轴(新)
价格行为 (新)
追踪智能算法 (新)
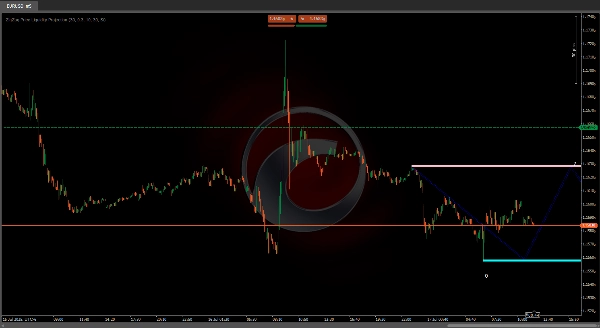
📊 锯齿价格流动性预测指标
“在市场转向之前看到它可能的方向!” 🔮
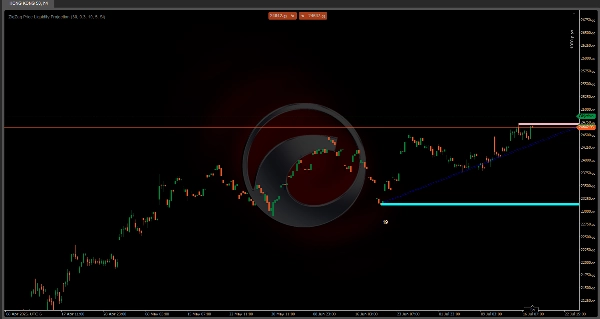
该指标识别 关键支撑/阻力水平 🛑 并 预测流动性区域 💧 在您的图表上,使用:
- 🔍 枢轴点:检测重要的高点和低点
- 📈 ATR 波动率:测量价格波动以实现精确调整
- 💦 流动性预测:通过锯齿形模式预测高活跃区域(买卖集群)
🎯 目的:预测价格反应区(反弹/突破/盘整),以改善进出场决策
✨ 锯齿优势
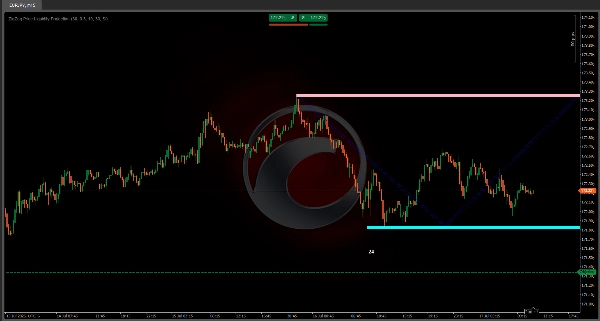
这些连接的线条就像一张 藏宝图 🗺️ 显示:
1️⃣ 未来价格路径 在定义的范围内
2️⃣ 潜在反转区域 价格可能停滞或反转的地方
3️⃣ 视觉参考点 用于交易规划
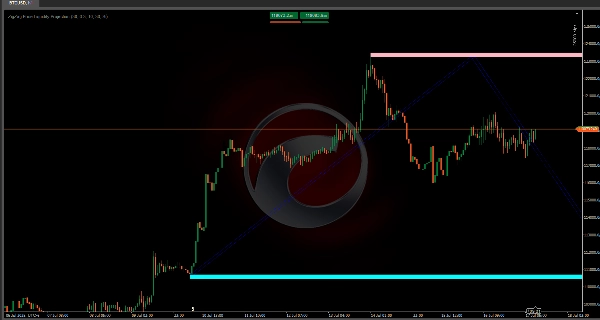
🚦 主要特征:
- 📅 重要水平的预警系统
- 🎯 基于枢轴结构预测未来走势(看涨/看跌路径)
- 🔢 触碰计数器 (例如,“24”=该水平的24次历史测试)
⚙️ 推荐设置
设置值效果
ATR 周期
30
🎚️ 波动率灵敏度
枢轴周期
30
🔍 枢轴显著性范围
⏳ 最佳时间框架:15分钟 - 4小时图表 ⏱️
💡 专业提示:
“结合蜡烛图形态 🕯️ 以确认!锯齿形显示价格可能去向,蜡烛图显示何时发生。”
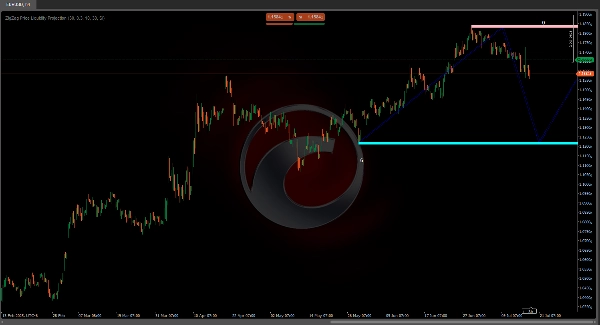
🎯 最终结论:
一个强大的 一体化视觉工具 用于识别:
✅ 流动性区域 💦
✅ 关键水平 🎯
✅ 未来价格路径 🚀
非常适合日内交易者,他们想要 预测走势而非追逐走势! 🏃💨
摘要
AI 摘要
The ZigZag Price Liquidity Projection is a trading indicator designed to identify key support and resistance levels and predict liquidity zones on price charts. It uses pivot points to detect significant highs and lows, Average True Range (ATR) to measure volatility, and zigzag patterns to anticipate areas of high trading activity, such as buy and sell clusters. This indicator visually projects potential future price paths within defined ranges and highlights possible reversal zones where price may stall or reverse. It includes features like an early warning system for important levels, projections of bullish and bearish pivot structures, and touch counters that show how many times a level has been historically tested. Recommended settings include an ATR period of 30 and a pivot period of 30, optimized for 15-minute to 4-hour timeframes. The tool is intended to assist intraday traders in anticipating price moves for improved entry and exit decisions. Combining this indicator with candlestick patterns can enhance timing accuracy by showing where price might go and when changes are likely to occur.
指标配置
客户评价
0.0
评价:0
客户评价
该产品尚无评价。已经试过了?抢先告诉其他人!
讨论
常见问答
cTrader Store 提供的所有产品,包括交易机器人、指标和插件,均由第三方开发者提供,仅供信息参考和技术访问之用。cTrader Store 并非经纪商,不提供投资建议、个人推荐或任何未来业绩保证。


价格
注册日期 03/10/2024
163
销售
37.98K
免费安装