
说明
与标准指标不同,此工具具有智能实时信号:在当前形成的蜡烛图上,信号箭头“闪烁”以指示潜在的交叉。这可以防止错误的入场,因为它警告您信号尚未确认,直到蜡烛图收盘。
专为半自动交易设计,适用于https://ctrader.com/products/3618?u=cLogic
主要特点:
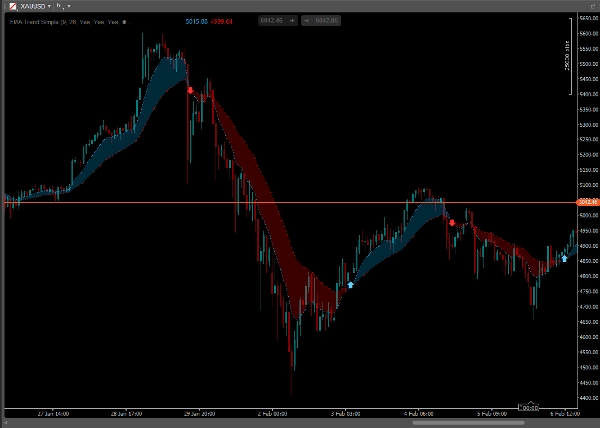
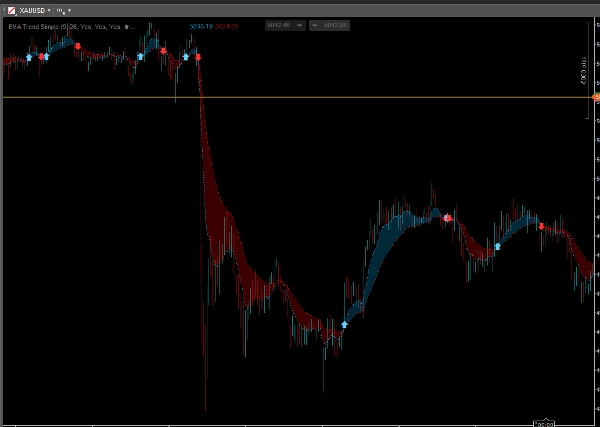
- ☁️ 趋势云: 自动填充快速和慢速EMA之间的空间,形成透明云层。
-
- 蓝色云: 上升趋势(快速EMA > 慢速EMA)。
- 红色云: 下降趋势(快速EMA < 慢速EMA)。
- 🏹 交叉信号: 在趋势变化时显示可自定义的箭头。
- ⚠️ 智能“闪烁”逻辑: 在活动(最后)柱上,如果实时发生交叉,箭头会闪烁。这帮助您监控市场波动,而不会被未确认的信号误导。蜡烛图收盘后,信号变为永久(非重绘)。
- 🎨 完全可定制:
-
- 更改EMA周期(快速/慢速)。
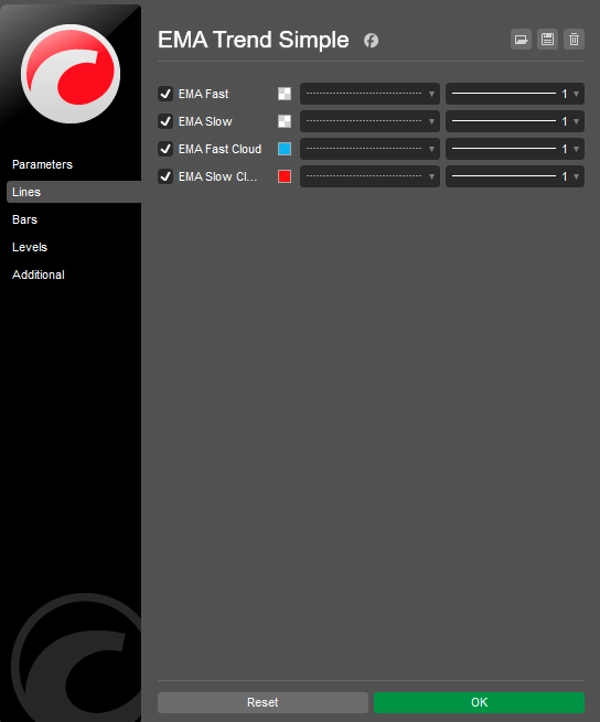
- 独立切换线条、云层或箭头。
- 自定义箭头符号(使用文本/Unicode)、颜色和大小。
如何解读:
- 买入信号: 云层变蓝,出现向上箭头。
- 卖出信号: 云层变红,出现向下箭头。
- 等待: 如果箭头在闪烁,说明蜡烛图尚未收盘——请等待收盘以确认信号。
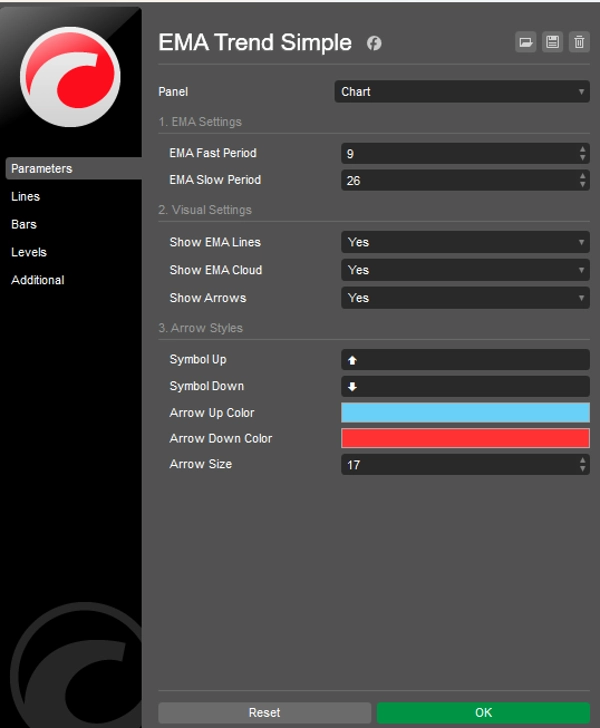
参数:
- EMA设置: 设定您偏好的周期(默认:9 和 26)。
- 视觉效果: 开启/关闭云层、线条或箭头,保持图表整洁。
- 样式: 选择您喜欢的箭头颜色和形状。
摘要
AI 摘要
EMA Trend Simple is a trend-following indicator designed for clarity and ease of use. It visually represents market trends by filling the area between two exponential moving averages (EMAs) with a transparent cloud: blue for uptrends (fast EMA above slow EMA) and red for downtrends (fast EMA below slow EMA). The indicator provides crossover signals with customizable arrows that appear precisely when the trend changes.
A distinctive feature is the Smart Live Signal: on the current forming candle, the signal arrow blinks to indicate a potential crossover, helping traders avoid false entries by waiting for candle close confirmation. Once confirmed, signals become permanent and non-repainting.
Users can fully customize EMA periods, toggle visibility of lines, clouds, and arrows independently, and adjust arrow symbols, colors, and sizes. The indicator supports semi-automatic trading integration.
To interpret signals: a blue cloud with an up arrow suggests a buy, a red cloud with a down arrow suggests a sell, and blinking arrows indicate unconfirmed signals pending candle closure.
EMA Trend Simple is applicable across various markets including Forex, cryptocurrencies, and commodities, supporting trend analysis and scalping strategies. It requires bar data input and outputs visual trend signals and crossover alerts.
指标配置
指标分类
趋势
输出类型
可视化
信号
数据要求
仅 K 线
支持的信号
交叉
客户评价
0.0
评价:0
客户评价
该产品尚无评价。已经试过了?抢先告诉其他人!
讨论
常见问答
BTCUSD
Prop
Forex
Scalping
EURUSD
Supertrend
Crypto
AI
XAUUSD
USDJPY
cTrader Store 提供的所有产品,包括交易机器人、指标和插件,均由第三方开发者提供,仅供信息参考和技术访问之用。cTrader Store 并非经纪商,不提供投资建议、个人推荐或任何未来业绩保证。


价格
24
销售
664
免费安装