
SmartTrend Support & Resistance Lines
指标
683 下载
版本 1.0, Apr 2025
Windows 版、Mac 版
说明
Pinescritlabs
Ctrader 商店指标: 🤖Pinescritlabs Ctrader 商店 cBots:
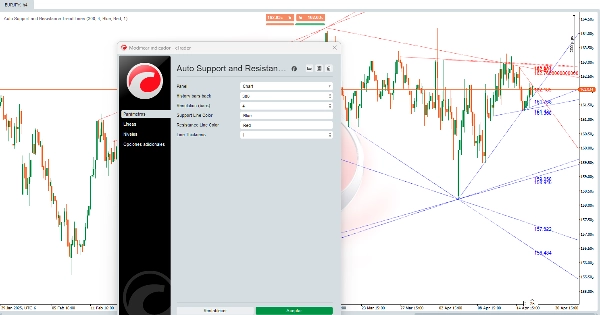
自动支撑和阻力趋势线:
该算法是一个强大的工具🛠️,旨在自动识别价格图上的支撑和阻力水平。它不仅绘制水平线,还描绘了表示市场趋势的斜向通道↗️↘️。这些水平和通道是价格难以向上(阻力🚧)或向下(支撑🛡️)移动的关键区域,对交易决策至关重要。📈📉
计算是如何完成的?🔍
该算法采用价格历史分析方法📊来识别支撑和阻力水平。其工作原理如下:
- 识别局部低点和高点⬇️⬆️
-
- 算法分析特定范围的柱(蜡烛)价格,以找到局部低点(该范围内的最低价格)和局部高点(该范围内的最高价格)。
- 这些局部低点和高点是可能成为支撑和阻力水平的候选点。
- 水平验证✔️
-
- 一旦识别出局部低点和高点,算法会检查这些水平是否在过去被价格尊重。
- 如果价格多次触及某一水平而未明显突破,则该水平被视为有效的支撑或阻力水平。
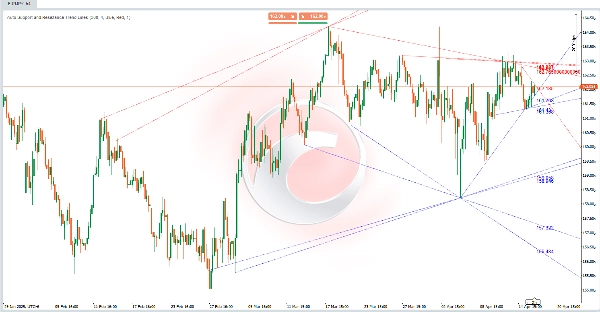
- 绘制线条和通道✏️
-
- 支撑水平绘制为水平(或斜向)线,位于验证过的局部低点。
- 阻力水平绘制为水平(或斜向)线,位于验证过的局部高点。
- 此外,算法连接这些水平形成斜向通道↗️↘️,代表市场中的看涨或看跌趋势。
- 动态更新🔄
-
- 该指标随着每个新柱自动更新,基于最新的价格行为重新计算并重绘支撑和阻力水平。
该算法如何帮助交易者?💡
该算法对交易者来说是一个游戏规则改变者,原因如下:
- 提供市场的宏观视角🌐
-
- 通过绘制斜向通道,算法展示了主要市场趋势,帮助交易者识别价格是处于上升趋势📈、下降趋势📉还是横盘走势↔️。
- 识别关键支撑和阻力区域🎯
-
- 支撑和阻力水平是价格可能反弹或突破的区域。这些水平对以下方面有用:
-
- 设定交易的进出点。
- 设置止损🛑和止盈✅订单。
- 识别价格的突破🚀或反转🔄。
- 简化技术分析🕒
-
- 该算法自动化识别支撑和阻力的过程,为进行手动分析的交易者节省时间。
- 通过清晰显示水平和通道,帮助交易者做出更明智的决策。
- 可定制🎨
-
- 交易者可以调整参数,如分析的历史柱数、线条粗细和颜色,使指标适应不同的交易风格和视觉偏好。
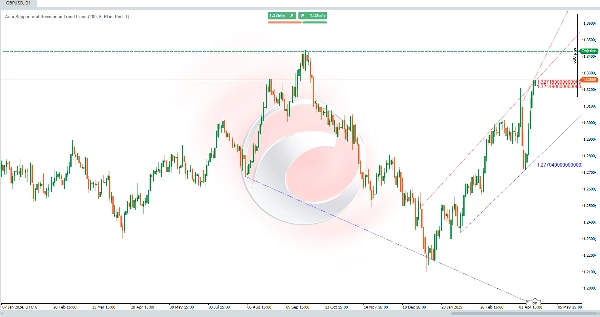
实际示例📌
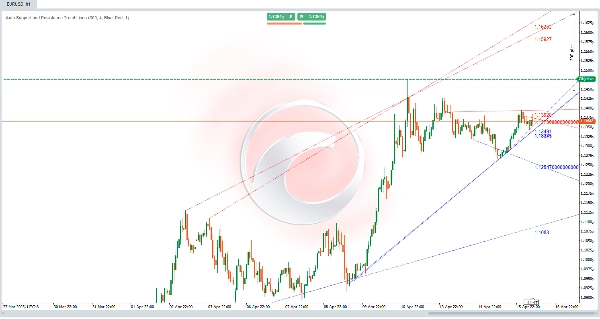
假设你正在分析价格图,算法绘制了:
- 一条斜向支撑线↗️连接多个局部低点,表明上升趋势。
- 一条斜向阻力线↗️连接多个局部高点,显示一个上升通道。
- 几条水平线,代表关键支撑和阻力水平。
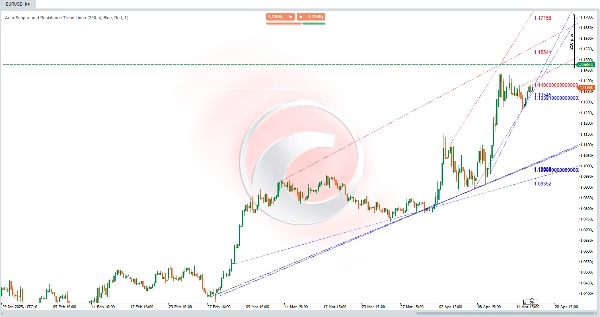
有了这些信息,你可以:
- 识别价格处于上升趋势📈。
- 寻找靠近斜向支撑线或水平支撑水平的买入机会。
- 在最近的支撑水平下方设置止损🛑。
- 观察价格是否突破阻力,以确认趋势的延续或潜在的反转🔄。
摘要
指标配置
客户评价
0.0
评价:0
客户评价
该产品尚无评价。已经试过了?抢先告诉其他人!
讨论
常见问答
BTCUSD
Breakout
Supertrend
Commodities
RSI
Crypto
XAUUSD
cTrader Store 提供的所有产品,包括交易机器人、指标和插件,均由第三方开发者提供,仅供信息参考和技术访问之用。cTrader Store 并非经纪商,不提供投资建议、个人推荐或任何未来业绩保证。


猜您喜欢


价格
注册日期 03/10/2024
163
销售
37.72K
免费安装