説明
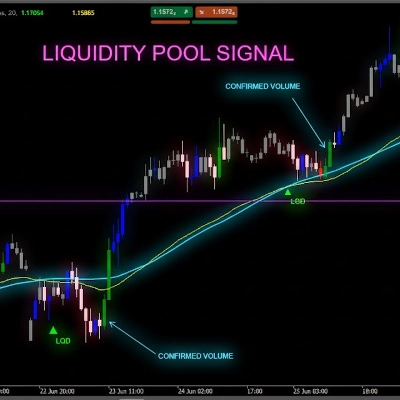
高い機関投資家の関心ゾーンを特定する: ブレイクでより多いボリュームがある場所には、大口プレイヤーのより大きな参加があります。
• ⚖️ 勢力バランスを測る: 各価格ゾーンで買い圧力または売り圧力が支配的かを確認します
• 🎯 重要なレベルを検出する: より高いブレイクボリュームのあるゾーンはしばしば将来のサポート/レジスタンスとして機能します
• ✅ 動きを確認する: 高いボリュームのブレイクアウトは本物である可能性が高い
https://chartshots.spotware.com/c/6941a3f65f376
📈 読み方は?
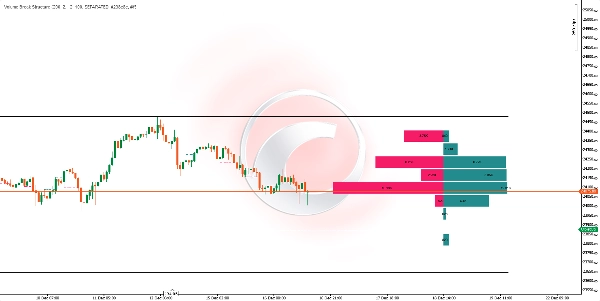
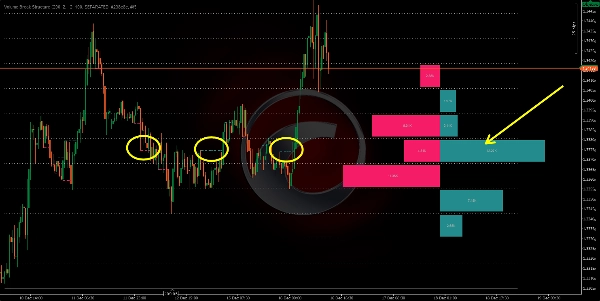
📊 横線
• 各線は構造のブレイクが発生したレベルを示します
• 🟢 強気のブレイク
• 🔴 弱気のブレイク
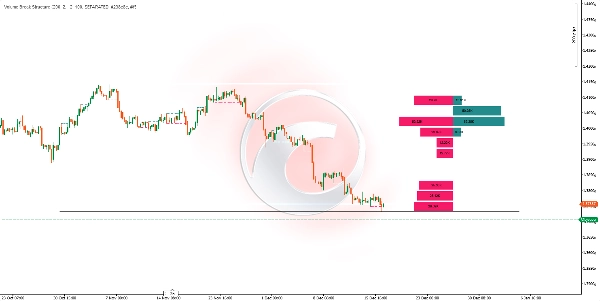
📈 ヒストグラム
• チャートの右側に位置します
• 等しい価格範囲を表す行に分割されています
• 📗 買い圧力バー: そのゾーンでの強気のブレイクの累積ボリューム
• 📕 売り圧力バー: そのゾーンでの弱気のブレイクの累積ボリューム
• ⬆️ バーのサイズ: 大きいほどそのレベルでのブレイクのボリュームが大きいことを示します
https://chartshots.spotware.com/c/6941a4346ede0
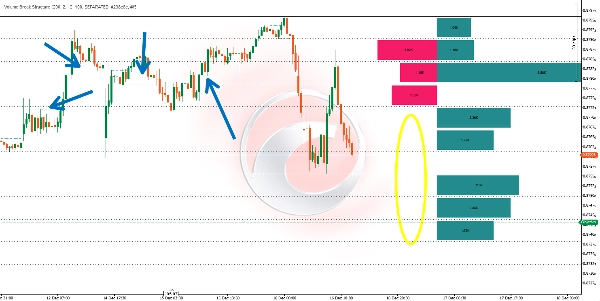
🟦 グリッド
• 実線の上下の線は分析期間の最大値と最小値の範囲を示します
• 点線はその範囲を等しい区間に分割し、読みやすくしています
⚙️ 🔧 主なパラメータ
パラメータ機能
🕯️ 計算バー数
遡って分析するローソク足の数の数
🎚️ スイング長さ
感度: ピボット検出のための感度(高いほど信号は少なく、より信頼性が高い)
📊 ヒストグラム行数
ヒストグラムの分割数/行数
📏 ヒストグラム幅
視覚的幅(ヒストグラムの幅)
👁️ 表示モード
分離表示(買い/売り)または集計表示(総ボリューム)
🔄 更新タイミングは?
🕒 インジケーターは各ローソク足の終値で自動的に再計算され、新たに発生した構造のブレイクを取り込みます。
💡 🤝 組み合わせ方は?
📈 トレンド分析と
• 上昇トレンドでは、買い圧力のボリュームが優勢なゾーンを探し、押し目買いのエントリーポイントとします
• 下降トレンドでは、売り圧力のボリュームが優勢なゾーンを探し、反発のエントリーポイントとします
🛡️ サポートとレジスタンスと
• 最も高いブレイクボリュームのレベルはしばしば将来の反応ゾーンになります
• ヒストグラムを使って、買い手または売り手によって最も「守られている」ゾーンを特定します
🌊 オーダーフローと
• ヒストグラムの読みをリアルタイムのオーダーフローツールで確認します
• 高いブレイクボリュームのゾーンはしばしば機関投資家の吸収エリアと一致します
🕯️ プライスアクションと
• ヒストグラムが顕著なアンバランスを示すゾーンでローソク足パターンを探します
• 高い買い圧力のゾーンでの反転パターンは成功の可能性が高い
🎯 🚀 クイック解釈
視覚的シグナル解釈
📗 大きな買いバー、📕 小さな売りバー
強い需要ゾーン、可能なサポート
📕 大きな売りバー、📗 小さな買いバー
強い供給ゾーン、可能なレジスタンス
⚔️ 両方のバーが大きく似ている
戦闘ゾーン、高いボラティリティが予想されます
⏭️ バーのない行
関心の薄いゾーン、価格が素早く通過した
重要な注意点
• ❌ インジケーターは確定した過去のデータに基づいて動作し、未来を予測しません
• 📊 計算バー数が多いほど、より広い視野が得られますが、最近のシグナルが薄まる可能性があります
• ⏰ 時間軸に応じてスイング長さを調整してください: 高い時間軸ではより大きな値を使用します
• 🛡️ 適切なリスク管理と常に組み合わせてください
概要
Key features include:
- Horizontal lines marking bullish (green) and bearish (red) structure breaks.
- A histogram on the right side of the chart divided into rows representing equal price ranges, showing accumulated volume of bullish and bearish breaks. Larger bars indicate higher volume.
- A grid marking the maximum and minimum price range of the analyzed period, divided into equal sections for easier reading.
The indicator recalculates automatically at the close of each candle, updating with any new structure breaks. Main adjustable parameters include the number of bars analyzed backward, swing length sensitivity for pivot detection, histogram rows, histogram width, and display mode (separated buy/sell or aggregated volume).
Volume Break Structure can be combined with trend analysis, support and resistance levels, order flow tools, and price action patterns to confirm market movements and identify potential entry points. It works with confirmed historical data and does not predict future price action.
カスタマーレビュー
5 | 0 % | |
4 | 100 % | |
3 | 0 % | |
2 | 0 % | |
1 | 0 % |