present
注册即可在首次购物时获得 $50 优惠
Trading product for MidasVolumeProfile 指标 Key Levels Volume, image 1
MidasVolumeProfile
指标
版本 1.3, Oct 2026
Windows 版、Mac 版
Trading product for MidasVolumeProfile 指标 Key Levels Volume, image 2
Trading product for MidasVolumeProfile 指标 Key Levels Volume, image 3
Trading product for MidasVolumeProfile 指标 Key Levels Volume, image 4
注册日期 27/09/2026

说明

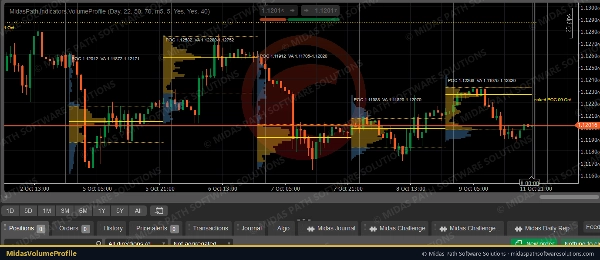
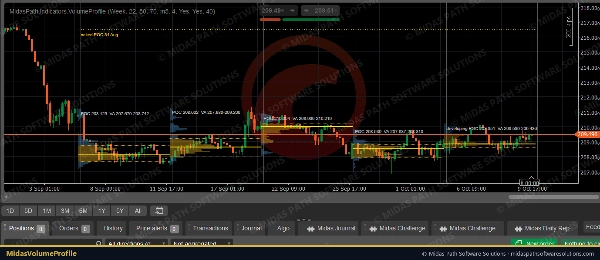
Midas Volume Profile shows where volume traded in each day or week, drawn as a histogram at the start of the session, with the levels profile traders use.


What it shows

• A volume histogram for each session, with the value area highlighted.

• POC (point of control): the price row with the most volume, drawn across the session.

• Value area high and low (VAH / VAL): the range around the POC that holds 70% of the session's volume (adjustable).

• Naked POCs: earlier sessions' POCs that price has not traded through since, extended to the right until price touches them.

• The developing profile of the current session, updated as each candle closes.


How it is built

• Volume is cTrader's tick volume (the number of price updates), the usual measure in forex and CFDs, where there is no central exchange volume. It is taken from a lower timeframe (5 minutes by default) for detail.

• Each candle's volume is shared across the price rows its high-low range covers, in proportion to the overlap. The session's range is split into 50 rows (adjustable).

• The value area grows from the POC towards whichever neighbouring row holds more volume, until it holds the chosen share.


Settings

• Profiles per day or per week, session start hour (22:00 UTC by default, the forex day), rows, value-area share, volume timeframe.

• Number of sessions shown, developing session on or off, naked POCs on or off, histogram width and colours.


Tested

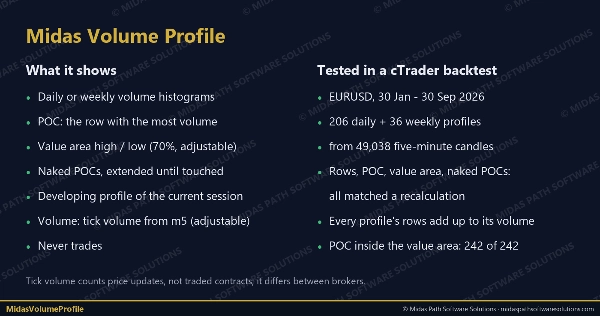
• In a cTrader backtest on EURUSD (30 Jan-30 Sep 2026), all 206 daily and 36 weekly profiles built from 49,038 five-minute candles matched an independent recalculation: session boundaries, every row's volume (each profile's rows add up to its total volume), POC, value area and every naked-POC touch.

• On that data the POC sat inside the value area in every profile, the value area held 71% of volume on average (rows are whole, so it slightly exceeds 70%), and 10 daily and 2 weekly POCs were still naked at the end.


Notes

• Tick volume counts price changes, not traded contracts; it differs between brokers.

• Volume profiles describe where trading happened; they do not predict where price will go.

• It never trades and needs no internet or file access.

摘要

AI 摘要
Midas Volume Profile is an indicator that visualizes session volume distribution using tick volume data, primarily for forex and CFD markets where centralized volume is unavailable. It displays a histogram of traded volume for each day or week at the session start, highlighting key levels used by volume profile traders.

Key features include:
- Point of Control (POC): the price level with the highest traded volume, extended across the session.
- Value Area High and Low (VAH/VAL): price range around the POC containing approximately 70% of the session’s volume, adjustable by the user.
- Naked POCs: POCs from previous sessions that price has not revisited, extended until touched.
- A developing profile for the current session, updated with each candle close.

The indicator calculates volume by distributing each candle’s tick volume proportionally across price rows within its high-low range, dividing the session range into adjustable rows (default 50). It supports profiles per day or week, customizable session start times, and visual settings such as histogram width and colors.

Midas Volume Profile operates without trading or internet access and has been tested for accuracy against independent recalculations on EURUSD data. It provides a detailed view of where trading activity concentrates but does not predict price direction.
指标配置
指标分类
交易量
输出类型
可视化
数据要求
仅 K 线

讨论

客户评价

0.0
评价:0
客户评价
该产品尚无评价。已经试过了?抢先告诉其他人!

常见问答

Key Levels
Volume
Support & Resistance
cTrader Store 提供的所有产品,包括交易机器人、指标和插件,均由第三方开发者提供,仅供信息参考和技术访问之用。cTrader Store 并非经纪商,不提供投资建议、个人推荐或任何未来业绩保证。

该作者的其他作品

桌面插件
File Access
Trade Journal
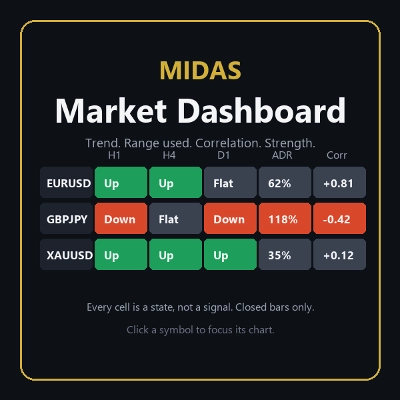
Your watchlist in one grid: trend on five timeframes, ADR used, correlation to the chart's symbol, currency strength.
指标
Key Levels
Liquidity Grab
+2
The levels you mark each morning, drawn and followed: PDH/PDL, weekly, monthly, sessions, equal highs/lows.
cBot
Partial Close
Prop Firm Fit
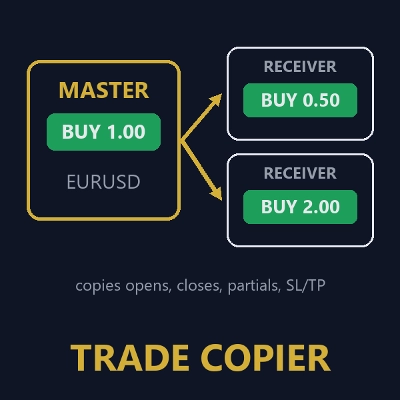
Copies opens, closes, partial closes and SL/TP from one cTrader account to others on the same PC, with safe sizing.
桌面插件
External Data
Study economic event reactions with broker M1 history, bar replay, range comparisons and a reproducible export.

猜您喜欢

指标
Volume
Order Block
+3
Map market structure, order blocks, liquidity and key zones with an interactive cTrader dashboard.
指标
SMC
Prop
+15
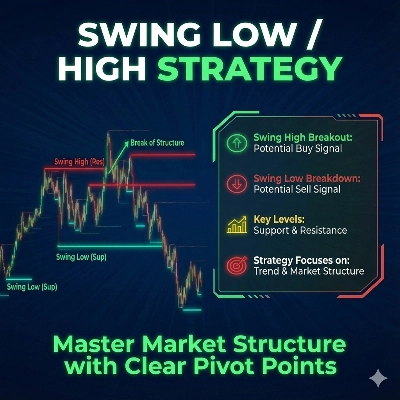
Auto-detects Swing Highs/Lows to draw dynamic Support & Resistance levels with break tracking.
指标
Signal
This Fair Value Gap (FVG) indicator is a technical analysis on multi-timeframe.
指标
Laguerre RSI: smoother, faster RSI with less noise. Great for spotting reversals and timing entries.
指标
ADX
ATR
+2
GOLD SENTINEL v1.0 - A CANDLE-COLORING INDICATOR FOR GOLD.
指标
ATR
RSI
+16
This trading game allows you to explore and practice investment strategies in a real-time market data environment.
指标
Forex
Customizable Dynamic Fibonacci Channels and Smart Alerts
指标
Signal
USDJPY
See USD demand in one line—Composite OBV fuses six major FX pairs into a clear momentum gauge.
指标
AI
ATR
+20
Detects smart money activity using advanced tick volume and price divergence analysis.
指标
SMC
Prop
+17
Unlock the true intent of market participants with the Classic Proportional Cumulative Volume Delta CVD!
指标
Prop
Forex
+14
🚀See the market’s framework, decide faster. Session-Aware Pivots. Auto Presets. Pro-Grade Zones.🚀
指标
Volume
Key Levels
View tick activity across a selected chart range with Point of Control, Value Area High and Value Area Low.
指标
BOS
CHOCH
+5
A professional-grade cTrader indicator for traders following the Inner Circle Trader (ICT) methodology. It replaces 6–8
指标
Signal
Cumulative Volume Delta tracks the net difference in tick volume between buying and selling pressure over time
指标
Forex
BTCUSD
+13
Sniper Zone Pro: High-precision institutional zones and candle strength for identifying key market tests.
指标
Pin Bar
Inducement
+5
Institutional Nasdaq Session Liquidity Map with Live Point HUD, Sweep Alerts & Interactive Playbook.
指标
Drawdown Monitor
Protect your funded account. Real-time Daily Equity Drawdown monitor with Green / Orange / Red flashing alerts.
指标
ATR
Key Levels
+1
Explore 88 harmonic price-pattern variants with interactive chart controls and geometric reference levels.

价格

注册日期 27/09/2026