说明
识别高机构兴趣区域:在突破中有更多成交量,就有大型参与者的更大参与度。
• ⚖️ 衡量力量平衡:查看每个价格区间中是买盘压力还是卖盘压力占主导
• 🎯 检测关键水平:具有更高突破量的区域通常作为未来支撑/阻力
• ✅ 确认走势:高成交量的突破具有更高的真实性概率
https://chartshots.spotware.com/c/6941a3f65f376
📈 如何阅读?
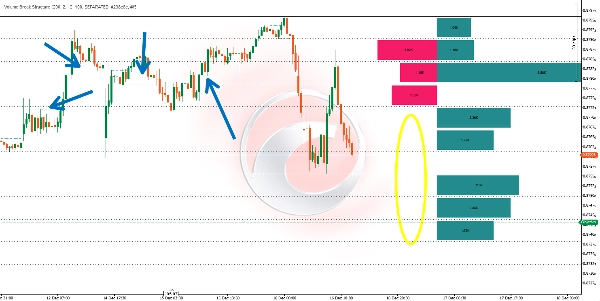
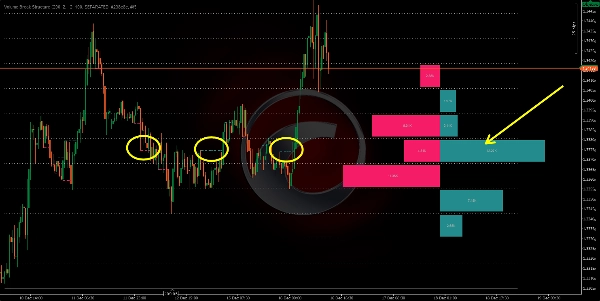
📊 横线
• 每条线标记了一个发生结构突破的位置
• 🟢 看涨突破
• 🔴 看跌突破
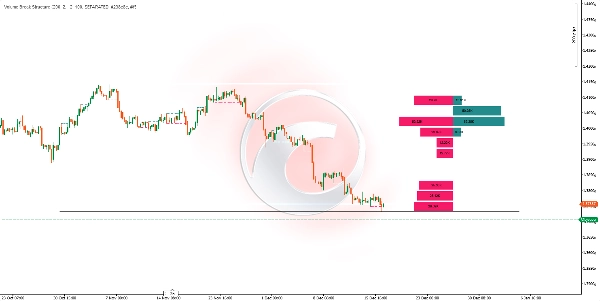
📈 直方图
• 位于图表的右侧
• 分为表示相等价格区间的行
• 📗 买方压力柱:该区域内看涨突破的累计成交量
• 📕 卖方压力柱:该区域内看跌突破的累计成交量
• ⬆️ 柱子大小:较大表示该水平的突破量更大
https://chartshots.spotware.com/c/6941a4346ede0
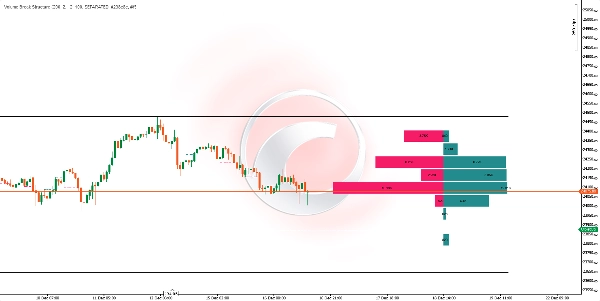
🟦 网格
• 实线的顶部和底部标记了分析周期的最大和最小范围
• 虚线将该范围划分为相等部分,便于阅读
⚙️ 🔧 主要参数
参数功能
🕯️ 计算柱数
向后分析的蜡烛数量向后
🎚️ 摆动长度
检测枢轴点的灵敏度(越高=信号越少,更可靠)
📊 直方图行数
直方图中的分割/行数
📏 直方图宽度
直方图的视觉宽度
👁️ 显示模式
分开显示(买/卖)或合并显示(总成交量)
🔄 何时更新?
🕒 指标在每根蜡烛收盘时自动重新计算,并纳入任何发生的新结构突破。
💡 🤝 如何结合使用?
📈 趋势分析
• 在上升趋势中,寻找买盘压力成交量占主导的区域,以便在回调时潜在入场
• 在下降趋势中,寻找卖盘压力成交量占主导的区域,以便在反弹时潜在入场
🛡️ 支撑与阻力
• 具有最高突破量的水平通常成为未来反应区
• 使用直方图识别买方或卖方最“防守”的区域
🌊 订单流
• 使用实时订单流工具确认直方图读数
• 高突破量区域通常与机构吸收区重合
🕯️ 价格行为
• 在直方图显示显著失衡的区域寻找蜡烛图形态
• 在高买盘压力区域出现的反转形态具有更高的成功概率
🎯 🚀 快速解读
视觉信号解读
📗 大买方柱,📕 小卖方柱
强需求区,可能是支撑
📕 大卖方柱,📗 小买方柱
强供应区,可能是阻力
⚔️ 两柱都大且相似
战斗区,预计高波动性
⏭️ 无柱的行
兴趣较低区,价格快速通过快速
重要注意事项
• ❌ 指标基于已确认的历史数据工作;不预测未来
• 📊 计算柱数越多,视野越宽广,但可能稀释近期信号
• ⏰ 根据时间框架调整摆动长度:高时间框架使用更高数值
• 🛡️ 始终结合适当的风险管理
摘要
Key features include:
- Horizontal lines marking bullish (green) and bearish (red) structure breaks.
- A histogram on the right side of the chart divided into rows representing equal price ranges, showing accumulated volume of bullish and bearish breaks. Larger bars indicate higher volume.
- A grid marking the maximum and minimum price range of the analyzed period, divided into equal sections for easier reading.
The indicator recalculates automatically at the close of each candle, updating with any new structure breaks. Main adjustable parameters include the number of bars analyzed backward, swing length sensitivity for pivot detection, histogram rows, histogram width, and display mode (separated buy/sell or aggregated volume).
Volume Break Structure can be combined with trend analysis, support and resistance levels, order flow tools, and price action patterns to confirm market movements and identify potential entry points. It works with confirmed historical data and does not predict future price action.
客户评价
5 | 0 % | |
4 | 100 % | |
3 | 0 % | |
2 | 0 % | |
1 | 0 % |