
说明
TrendFallowing:是cTrader平台上的一款高级技术指标,将多种分析方法结合为一体。专为寻求通过指标汇聚确认趋势的交易者开发,提供完整的市场视图,具有精准的信号和验证过滤器。
观看操作策略介绍视频!
🎯 使用策略
1. 趋势跟随交易
应用:识别并跟随已建立的趋势
时间框架:H4,D1,适合较长仓位
设置:ADX > 25,成交量高于平均水平
风险管理:止损设在50周期移动平均线下方
2. 摆动交易
应用:捕捉中期波动
时间框架:H1,H4
设置:启用成交量过滤器,通过成交量轮廓确认
目标:以成交量轮廓POC作为止盈点
3. 突破交易
应用:在支撑/阻力突破时入场
设置:使用PVA成交量确认走势强度
确认:ADX上升 + 成交量高于平均
4. 剥头皮交易(更短时间框架)
应用:快速交易,需多重确认
时间框架:M1,M5
设置:严格的成交量过滤器和动量指标
🔧 指标工作原理
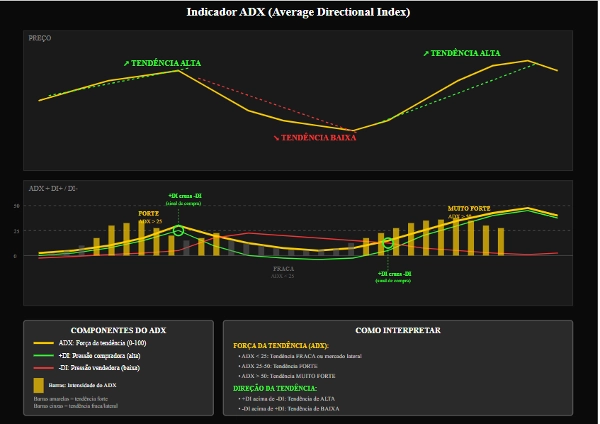
核心ADX & DI
ADX(平均方向指数)
功能:衡量趋势强度
解读:
0-25:弱趋势/横盘
25-50:强趋势
50以上:非常强的趋势
实际应用:当ADX < 20时避免交易
+DI / -DI(方向指标)
+DI:买方力量
-DI:卖方力量
信号:+DI上穿-DI(买入),反之亦然
ADX斜率(ADX Slope)
功能:衡量趋势加速度
绘图:青色柱状图
信号:正值表示趋势增强
成交量过滤器
成交量MA过滤器
功能:用高于平均的成交量验证信号
参数:周期20,乘数1.0
用途:确认机构兴趣
PVA成交量(价格成交量分析)
颜色及含义:
绿色:非常高成交量买入(>150%平均)
蓝色:高成交量买入
红色:非常高成交量卖出
粉色:高成交量卖出
黄色:针形线/耗尽伴随支撑突破
成交量轮廓
POC(控制点)
功能:成交量最高的价格
用途:交易的自然目标,动态支撑/阻力
价值区
功能:成交量占70%的区域
解读:
价格高于:上升趋势
价格低于:下降趋势
区间内:可能的横盘
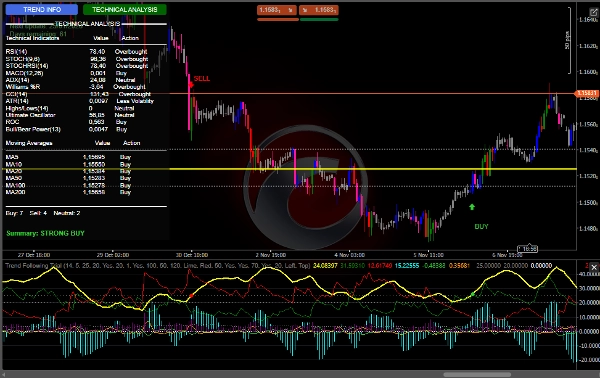
指标面板
RSI:超卖(<30)/ 超买(>70)
MACD:动量
Williams %R:极端状态
CCI:反转识别
随机指标:短期动量
终极振荡器:多时间框架动量
移动平均线
完整的MA组(5,10,20,50,100,200)
趋势对齐分析
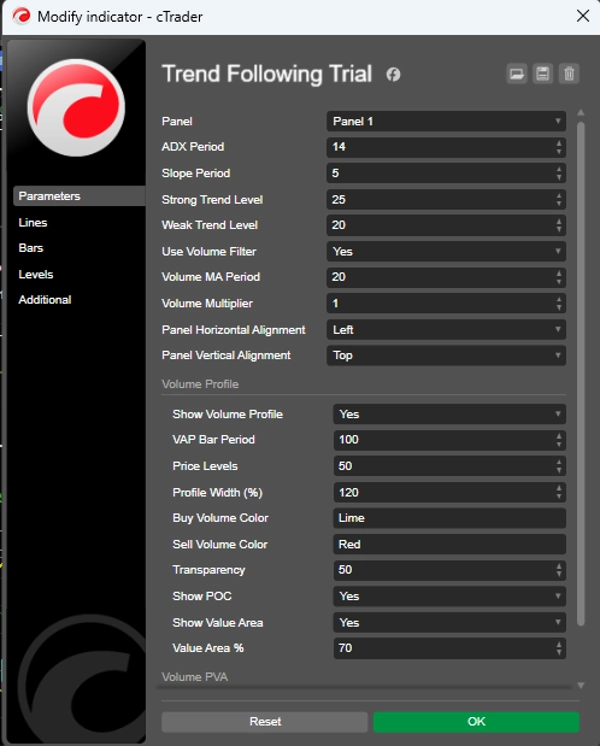
⚙️ 推荐设置
保守设置
ADX周期:14
斜率周期:5
强趋势水平:25
弱趋势水平:20
使用成交量过滤器:true
成交量MA周期:20
成交量乘数:1.2
激进设置
ADX周期:10
斜率周期:3
强趋势水平:20
弱趋势水平:15
使用成交量过滤器:true
MA成交量周期:14
成交量乘数:1.0
成交量轮廓(推荐)
显示成交量轮廓:true
VAP柱周期:100
价格水平:50
价值区百分比:70
显示POC:true
🎨 视觉资源
用户界面
动态面板:实时信息
交互按钮:切换分析视图
直观颜色:基于功能的编码
图形信号
箭头:买入/卖出入场点
声音:可听警报
柱颜色:集成PVA分析


