Descrizione
QUESTO Initial Balance deve essere utilizzato SOLO su GOLD: XAUUSD
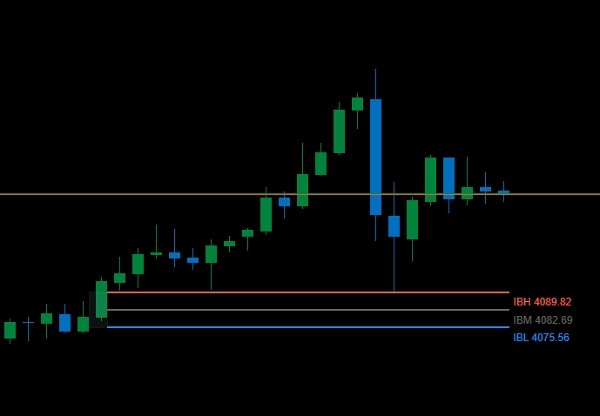
Base e GRATUITO. Traccia l'Initial Balance di New York (ora locale NY)Initial Balance (ora locale NY) e proietta IB High, IB Low, e opzionale Midline dalla fine dell'IB all'inizio dell'IB del giorno successivo.
I valori IB sono calcolati da candele standard da 1 minuto, quindi i livelli rimangono precisi su qualsiasi tipo di grafico (Renko, Heikin Ashi, Range, Tick, ecc.).
Include una scatola IB ombreggiata e etichette prezzo sul bordo destro. Consapevole del DST (ancorato alla data locale di NY).
Caratteristiche principali
- Finestra IB fissa
- Livelli: IB High / IB Low / (opzionale) Midline
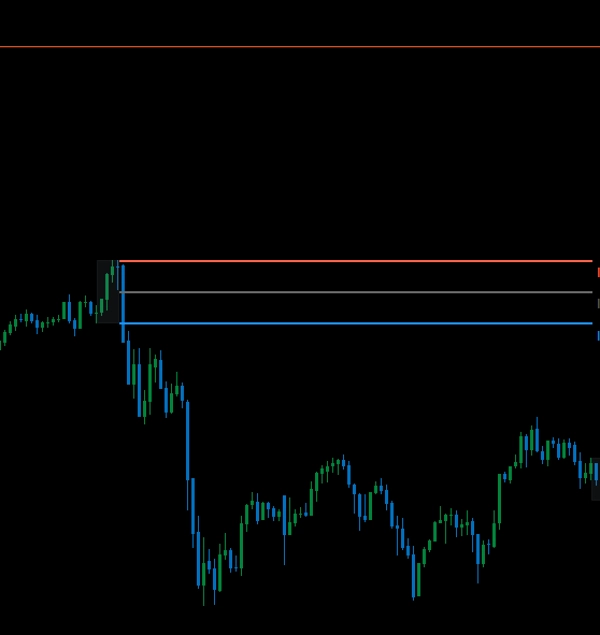
- Estendi fino all'inizio del prossimo IB (non solo alla chiusura della sessione)
- Funziona su qualsiasi tipo di grafico
- Scatola IB ombreggiata + etichette prezzo
Input
- Mostra Midline: On/Off
- Estendi fino all'inizio del prossimo IB: On/Off
Compatibilità
- Indicatore cTrader (cAlgo)
- Simboli/mercati con dati intraday
- Progettato per grafici in UTC; gestione automatica dell'orario di NY (DST)
Note
- La fonte IB utilizza candele basate sul tempo da 1 minuto internamente per precisione.
- Le linee persistono oltre la mezzanotte quando “Estendi fino all'inizio del prossimo IB” è abilitato.
Non è un consiglio finanziario. Questo è uno strumento base, GRATUITO fornito così com'è per scopi educativi e informativi.
Riepilogo
Key features include a fixed IB window, extension of IB levels to the start of the next day’s IB session, a shaded IB box for visual clarity, and right-edge price labels. The indicator is DST-aware, automatically adjusting to New York local date and time changes. Users can toggle the display of the midline and the extension of IB levels to the next IB start.
This tool is compatible with symbols and markets that provide intraday data and is designed for charts running in UTC time. It serves as a basic, informational indicator for educational purposes and does not provide financial advice.


![Logo di "[Hamster-Coder] Moving Average MTF"](https://cdn.ctrader.com/image/webp/b11b98b1-194d-4b8e-b00e-d611826ad159_31226)