
Mô tả
Tổng quan
Swing Flow là một chỉ báo theo xu hướng tiên tiến hiển thị trực tiếp trên biểu đồ giá, cung cấp cho bạn một tín hiệu trực quan rõ ràng, trực quan — tương tự phong cách với SuperTrend cổ điển — nhưng được hỗ trợ bởi logic cơ bản khác biệt và tinh vi hơn.
Trong khi các chỉ báo xu hướng tiêu chuẩn phản ứng với từng cây nến, Swing Flow neo các phép tính của nó vào các điểm xoay quan trọng của thị trường, tạo ra một đường thực sự phản ánh xu hướng chi phối với ít nhiễu và tín hiệu sai hơn nhiều.
Cách hoạt động (Không tiết lộ công thức)
Swing Flow xác định các đỉnh và đáy xoay có ý nghĩa trên thị trường — các điểm quay tự nhiên nơi giá thực sự đã đảo chiều. Sau đó nó xây dựng một mức trung tâm động và hai dải thích ứng (trên và dưới) quanh các điểm xoay đó, áp dụng làm mượt điều chỉnh theo biến động để lọc ra các biến động ngắn hạn.
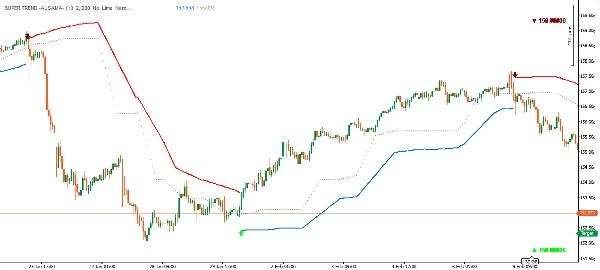
Kết quả là một đường xu hướng đơn được hiển thị trên biểu đồ:
- 🟢 Đường màu xanh lá bên dưới giá → Xu hướng tăng (đóng vai trò hỗ trợ động)
- 🔴 Đường màu đỏ bên trên giá → Xu hướng giảm (đóng vai trò kháng cự động)
Khi xu hướng đảo chiều, đường sẽ đổi bên và màu sắc — giống hệt như SuperTrend — làm cho nó ngay lập tức rõ ràng và có thể hành động được.
Các thành phần của chỉ báo
Mô tả thành phần
Đường xu hướng chính
Đường tín hiệu chính — màu xanh lá bên dưới giá khi xu hướng tăng, màu đỏ bên trên khi xu hướng giảm
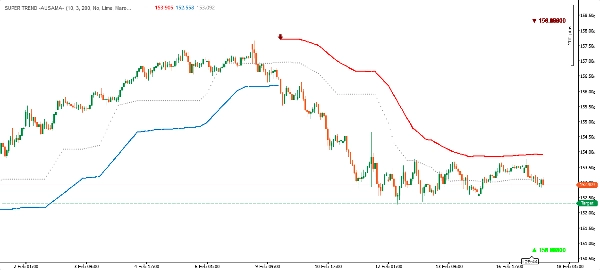
Dải trên
Mức kháng cự động, hiển thị trong các giai đoạn giảm giá
Dải dưới
Mức hỗ trợ động, hiển thị trong các giai đoạn tăng giá
Đường giữa
Đường trung tâm thích ứng được lấy từ cấu trúc thị trường
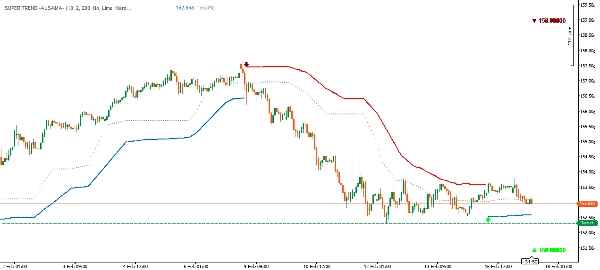
Các dấu hiệu tín hiệu
Mũi tên lên/xuống với nhãn giá tại mỗi lần đảo chiều xu hướng
Nhãn điểm xoay (tùy chọn)
Các dấu kim cương tại các đỉnh và đáy xoay (có thể bật/tắt)
Ưu điểm chính
✅ Logic dựa trên cấu trúc
Không giống như hầu hết các chỉ báo xu hướng chỉ xem xét hành động giá gần đây, Swing Flow được xây dựng trên các điểm xoay thị trường thực tế — các mức mà thị trường đã xác nhận là quan trọng. Điều này làm cho tín hiệu xu hướng có ý nghĩa cơ bản hơn.
✅ Bộ lọc biến động thích ứng
Các dải tự động điều chỉnh theo biến động thị trường hiện tại, thu hẹp trong điều kiện yên tĩnh và mở rộng trong các giai đoạn biến động. Điều này giảm thiểu các tín hiệu nhiễu mà không cần điều chỉnh thủ công.
✅ Hiển thị phong cách SuperTrend sạch sẽ
Mặc dù có logic tiên tiến, kết quả hiển thị rất sạch sẽ và quen thuộc. Một đường trên biểu đồ — màu xanh bên dưới, màu đỏ bên trên. Không rối mắt. Dễ đọc ngay lập tức trên mọi khung thời gian.
✅ Tín hiệu vào lệnh chính xác
Mỗi thay đổi xu hướng được đánh dấu bằng một mũi tên chỉ hướng và giá đóng cửa chính xác tại thanh đảo chiều, cung cấp cho bạn điểm tham chiếu rõ ràng cho việc vào lệnh.
✅ Tùy chỉnh màu sắc đầy đủ
Cả màu tăng và giảm đều có thể tùy chỉnh hoàn toàn để phù hợp với phong cách biểu đồ hoặc sở thích cá nhân của bạn.
✅ Hoạt động trên tất cả các thị trường & khung thời gian
Forex, chỉ số, hàng hóa, tiền điện tử — chỉ báo tự nhiên thích ứng với bất kỳ công cụ và khung thời gian nào nhờ thiết kế nhận biết biến động.
Cách sử dụng
Theo xu hướng: Theo xu hướng theo hướng của đường — mua khi đường màu xanh (bên dưới giá), bán hoặc đứng ngoài khi đường màu đỏ (bên trên giá).
Hỗ trợ & Kháng cự động: Dải hoạt động đóng vai trò là mức hỗ trợ (tăng) hoặc kháng cự (giảm) theo thời gian thực. Giá quay lại đường mà không phá vỡ là tín hiệu tiếp tục.
Tín hiệu vào lệnh: Các dấu mũi tên (▲ / ▼) chỉ ra sự thay đổi xu hướng đã được xác nhận. Chúng có thể được sử dụng làm tín hiệu vào lệnh, đặc biệt khi kết hợp với các yếu tố khác trên biểu đồ của bạn.
Tham chiếu điểm xoay (tùy chọn): Bật "High & Lows" để hiển thị các điểm xoay mà chỉ báo sử dụng bên trong. Hữu ích để hiểu cấu trúc thị trường ngay lập tức.
Swing Flow so với SuperTrend tiêu chuẩn
Tính năngSuperTrend tiêu chuẩnSwing Flow
Cơ sở tính toán
Mỗi cây nến
Các điểm xoay thị trường đã được xác nhận
Nhiễu tín hiệu
Cao hơn — phản ứng với mỗi thanh
Thấp hơn — neo vào cấu trúc
Tín hiệu sai
Phổ biến hơn trong thị trường dao động
Giảm đáng kể
Khả năng thích ứng
Hệ số ATR cố định
Các dải làm mượt theo biến động
Phong cách hiển thị
Một đường đơn
Một đường + dải + mức trung tâm
Xác nhận vào lệnh
Thay đổi màu
Mũi tên + nhãn giá tại điểm đảo chiều
Hiển thị điểm xoay
Không có
Các dấu điểm xoay tùy chọn
Tóm lại: Swing Flow trông giống SuperTrend, nhưng suy nghĩ như một nhà giao dịch hành động giá.
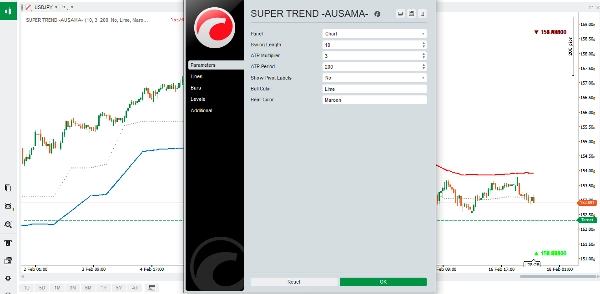
Các tham số đầu vào
Tham sốMặc địnhMô tả
Độ dài Swing
10
Điều khiển độ nhạy phát hiện điểm xoay
Hệ số ATR
2.0
Độ rộng dải so với biến động
Chu kỳ ATR
200
Khoảng nhìn lại để đo biến động
Hiển thị nhãn điểm xoay
Tắt
Bật/tắt các dấu điểm xoay cao/thấp trên biểu đồ
Màu tăng
Lime
Màu cho xu hướng tăng
Màu giảm
Maroon
Màu cho xu hướng giảm
Mẹo để đạt kết quả tốt nhất
- Độ dài Swing thấp hơn (5–8): Nhạy hơn, nhiều tín hiệu hơn — phù hợp cho giao dịch lướt sóng hoặc giao dịch tích cực.
- Độ dài Swing cao hơn (14–20): Ít tín hiệu hơn, chất lượng cao hơn — phù hợp cho giao dịch swing hoặc giao dịch vị thế.
- Tăng hệ số ATR trong các thị trường biến động cao (ví dụ: tiền điện tử) để tránh đảo chiều sai.
- Giảm hệ số ATR trong các thị trường ổn định, có xu hướng để có tín hiệu chặt chẽ hơn.
- Tốt nhất nên sử dụng kèm xác nhận xu hướng từ các khung thời gian cao hơn.
Swing Flow — Nơi cấu trúc thị trường gặp sự rõ ràng của xu hướng.


![Logo "[Hamster-Coder] Moving Average MTF"](https://cdn.ctrader.com/image/webp/b11b98b1-194d-4b8e-b00e-d611826ad159_31226)


