说明
✨ 为什么选择
功能
描述
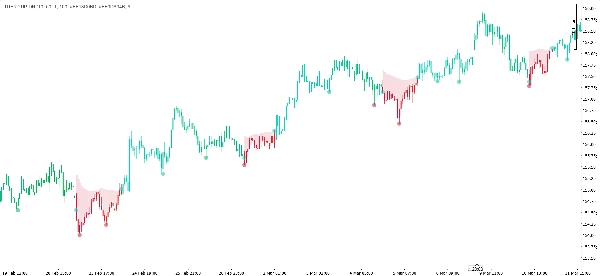
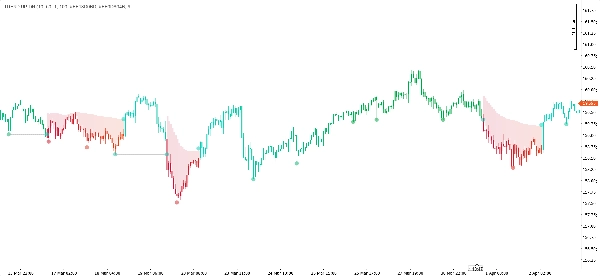
🎯 自适应枢轴检测
使用智能枢轴检测算法高精度识别潜在反转点
📊 动态自适应带
基于市场波动性自动扩展和收缩,使用ATR和SMA
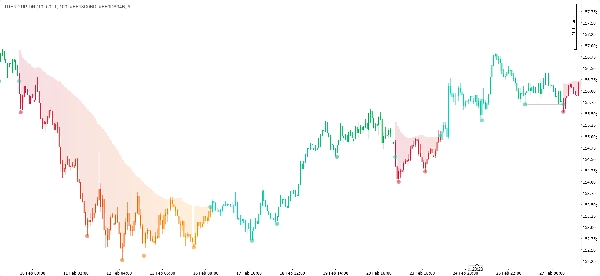
🎨 智能蜡烛着色
蜡烛从“新鲜”到“成熟”的渐变,直观评估趋势强度
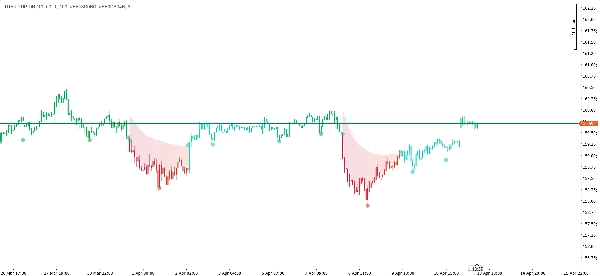
🟦 关键区域阴影
用透明填充突出显示看跌阻力区,便于市场解读
⚡ 清晰的进出场信号
当价格突破带或关键支撑位时出现彩色点
🧹 干净、无杂乱的界面
带仅在看跌阶段出现 — 在看涨阶段自动消失
🔧 完全可自定义设置
完全控制颜色、透明度和指标灵敏度
⚙️ 参数说明
🔹 组别:设置
参数
默认值
描述
枢轴检测长度
5
确认枢轴点的蜡烛数量(数值越高=越准确,信号越少)
自适应带最大长度
50
看跌带SMA计算的最大回溯期
自适应带乘数
1.0
带宽的ATR乘数 — 增加以加宽带并减少错误信号
🔹 组别:趋势风格
参数
默认值
描述
趋势老化长度
100
颜色从“新鲜”到“成熟”的蜡烛数量
看涨新鲜颜色
#FF18D0BD
新形成的看涨趋势颜色
看涨成熟颜色
#FF0DA94B
已建立/强劲看涨趋势颜色
看跌新鲜颜色
#FFCF1D3A
新形成的看跌趋势颜色
看跌成熟颜色
#FFFF8C00
已建立/强劲看跌趋势颜色
填充不透明度 (0-100%)
15
看跌区域阴影的透明度级别(0 = 透明,100 = 不透明)
📖 使用方法 — 逐步指南
🔵 看涨阶段 — 带隐藏
12345678
🔴 看跌阶段 — 红色带可见
12345678
🔄 趋势转换逻辑
1234567891011
💡 专业交易提示
🔸 推荐时间框架:最佳适用于M15及以上 — 避免非常短的时间框架以减少市场噪音。
🔸 风险管理:使用枢轴点(圆形标记)作为潜在止损位。
🔸 信号确认:结合成交量分析或动量振荡器(如RSI、MACD)以提高入场概率。
🔸 视觉定制:调整颜色以匹配您的图表主题 — 柔和颜色减少长时间交易时的眼睛疲劳。
🔸 先回测:始终先在模拟账户测试,以根据您的交易风格和工具微调参数。
🔸 多工具使用:指标适应不同波动性特征 — 适用于外汇对、黄金、指数和加密货币。
📦 系统要求
✅ 平台:cTrader(版本5.0或更高)
✅ 语言支持:C# / cAlgo API
✅ 权限:无需特殊访问权限(AccessRights: None)
✅ 兼容性:适用于所有外汇对、商品、指数和加密货币
✅ 性能:针对实时计算优化,资源使用最小化
🔧 安装说明
下载.cs指标文件
打开cTrader → 自动交易 → cAlgo
点击“添加” → 浏览并选择下载的文件
编译指标(预期无错误)
附加到任意图表:右键图表 → 指标 → Trend Pulse [BigBeluga]
在设置面板中自定义参数
点击“确定”应用
🔄 更新与维护
指标在每根新蜡烛时自动更新计算
图表对象(线条、点、矩形)自动管理以防止杂乱
无需手动清理 — 所有临时绘图均内部处理
⚠️ 免责声明:此指标仅供教育和分析用途。金融市场交易存在重大亏损风险。过去表现不保证未来结果。切勿仅依赖单一指标做出投资决策。始终自行分析并在需要时咨询持牌金融顾问。
🎁 准备好体验真正的市场脉搏了吗?
1
🔹 技术支持或问题:直接联系我们
🔹 未来更新:关注我们的官方渠道
“分析清晰 = 决策自信” 🎯
📋 快速参考备忘单
12345678910111213141516
© Trend Pulse [BigBeluga] — 灵感来源于BigBeluga的原始Pine Script,遵循CC BY-NC-SA 4.0许可。cTrader的改编和增强由[您的姓名/品牌]完成。
摘要
Visual elements include smart candle coloring that transitions from "Fresh" to "Mature" to indicate trend strength, and shaded bearish resistance zones for clearer market interpretation. Entry and exit signals are marked by colored dots when price breaks the band or key support levels. The interface remains clean by displaying the bearish band only during downtrends, disappearing automatically in bullish phases.
Users have full customization over colors, transparency, and sensitivity parameters, allowing adaptation to various trading styles and instruments. The indicator supports multiple markets including forex pairs, commodities, indices, and cryptocurrencies, and is optimized for timeframes of 15 minutes and above to reduce noise. It updates calculations in real time with minimal resource usage and manages chart objects automatically to prevent clutter.
TREND UP-DN is implemented in C# using the cAlgo API and requires no special permissions. It is intended for analytical and educational purposes to assist traders in identifying trend phases and potential reversal points.