
Descripción
Resumen
Swing Flow es un indicador avanzado de seguimiento de tendencias que se muestra directamente en el gráfico de precios, ofreciéndote una señal visual limpia e intuitiva — similar en estilo al clásico SuperTrend — pero impulsado por una lógica subyacente fundamentalmente diferente y más sofisticada.
Mientras que los indicadores de tendencia estándar reaccionan a cada vela, Swing Flow ancla sus cálculos a puntos de giro significativos del mercado, produciendo una línea que refleja verdaderamente la tendencia dominante con mucho menos ruido y señales falsas.
Cómo Funciona (Sin Revelar la Fórmula)
Swing Flow identifica máximos y mínimos pivote significativos en el mercado — los puntos de giro naturales donde el precio realmente ha revertido. Luego construye un nivel medio dinámico y dos bandas adaptativas (superior e inferior) alrededor de esos pivotes, aplicando un suavizado ajustado a la volatilidad para filtrar las fluctuaciones a corto plazo.
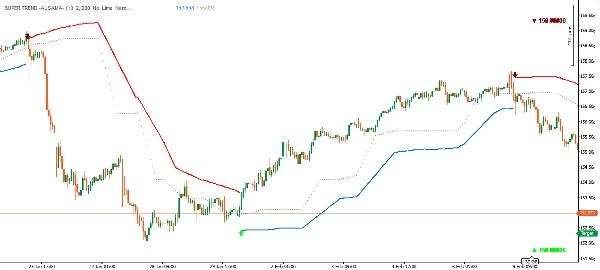
El resultado es una única línea de tendencia mostrada en el gráfico:
- 🟢 Línea verde debajo del precio → Tendencia alcista (actúa como soporte dinámico)
- 🔴 Línea roja encima del precio → Tendencia bajista (actúa como resistencia dinámica)
Cuando la tendencia cambia, la línea cambia de lado y color — exactamente como SuperTrend — haciéndolo inmediatamente obvio y accionable.
Componentes del Indicador
Descripción del Componente
Línea Principal de Tendencia
La línea de señal primaria — verde debajo del precio en tendencia alcista, roja encima en tendencia bajista
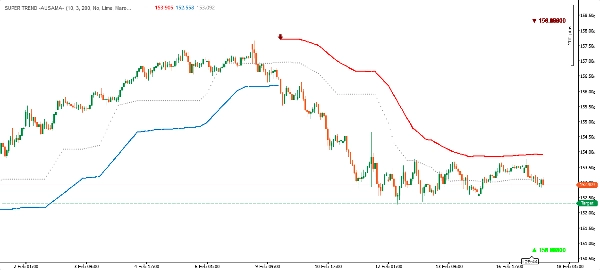
Banda Superior
Nivel de resistencia dinámico, mostrado durante fases bajistas
Banda Inferior
Nivel de soporte dinámico, mostrado durante fases alcistas
Línea Media
La línea central adaptativa derivada de la estructura del mercado
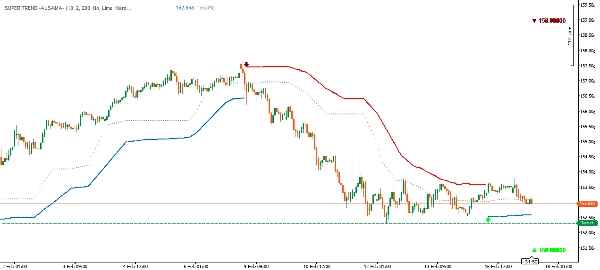
Marcadores de Señal
Flechas arriba/abajo con etiquetas de precio en cada reversión de tendencia
Etiquetas de Pivote (opcional)
Marcadores de diamante en máximos y mínimos de oscilación (pueden activarse o desactivarse)
Ventajas Clave
✅ Lógica Basada en la Estructura
A diferencia de la mayoría de los indicadores de tendencia que solo miran la acción reciente del precio, Swing Flow se basa en puntos de pivote de oscilación reales — los niveles que el mercado ya ha validado como significativos. Esto hace que la señal de tendencia sea fundamentalmente más significativa.
✅ Filtro Adaptativo de Volatilidad
Las bandas se ajustan automáticamente a la volatilidad actual del mercado, estrechándose en condiciones tranquilas y ampliándose durante períodos volátiles. Esto reduce los falsos cambios sin necesidad de ajuste manual.
✅ Visualización Limpia Estilo SuperTrend
A pesar de su lógica avanzada, la salida visual es limpia y familiar. Una línea en el gráfico — verde abajo, rojo arriba. Sin desorden. Inmediatamente legible en cualquier marco temporal.
✅ Señales de Entrada Precisas
Cada cambio de tendencia está marcado con una flecha direccional y el precio exacto de cierre en la barra de reversión, dándote un punto de referencia claro para las entradas.
✅ Personalización Completa de Colores
Los colores tanto para tendencias alcistas como bajistas son totalmente personalizables para que coincidan con tu estilo de gráfico o preferencia personal.
✅ Funciona en Todos los Mercados y Marcos Temporales
Forex, índices, commodities, criptomonedas — el indicador se adapta naturalmente a cualquier instrumento y marco temporal gracias a su diseño consciente de la volatilidad.
Cómo Usar
Seguimiento de Tendencia: Sigue la tendencia en la dirección de la línea — compra cuando la línea es verde (debajo del precio), vende o mantente fuera cuando la línea es roja (encima del precio).
Soporte y Resistencia Dinámicos: La banda activa sirve como un nivel de soporte (alcista) o resistencia (bajista) en tiempo real. El precio que regresa a la línea sin romperla es una señal de continuación.
Señales de Entrada: Los marcadores de flecha (▲ / ▼) indican un cambio de tendencia confirmado. Estos pueden usarse como disparadores de entrada, especialmente cuando se alinean con otras confluencias en tu gráfico.
Referencia de Pivote (opcional): Activa "Máximos y Mínimos" para mostrar los puntos de pivote de oscilación que el indicador usa internamente. Útil para entender la estructura del mercado de un vistazo.
Swing Flow vs. SuperTrend Estándar
CaracterísticaSuperTrend EstándarSwing Flow
Base de cálculo
Cada vela individual
Pivotes de oscilación validados por el mercado
Ruido de señal
Mayor — reacciona a cada barra
Menor — anclado a la estructura
Señales falsas
Más comunes en mercados volátiles
Significativamente reducidas
Adaptabilidad
Multiplicador ATR fijo
Bandas suavizadas por volatilidad
Estilo visual
Línea única
Línea única + bandas + nivel medio
Confirmación de entrada
Cambio de color
Flecha + etiqueta de precio en la reversión
Visibilidad de pivote
Ninguna
Marcadores de pivote opcionales
En resumen: Swing Flow se ve como SuperTrend, pero piensa como un trader de acción del precio.
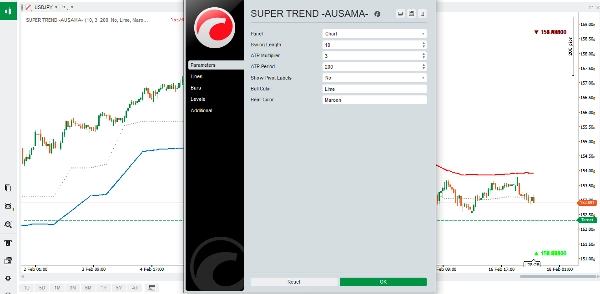
Parámetros de Entrada
ParámetroPredeterminadoDescripción
Longitud de Oscilación
10
Controla la sensibilidad de detección de pivotes
Multiplicador ATR
2.0
Ancho de banda relativo a la volatilidad
Periodo ATR
200
Periodo de retroceso para la medición de volatilidad
Mostrar Etiquetas de Pivote
Desactivado
Alternar marcadores de máximos/mínimos en el gráfico
Color Alcista
Lima
Color para tendencia alcista
Color Bajista
Granate
Color para tendencia bajista
Consejos para Mejores Resultados
- Longitud de Oscilación Baja (5–8): Más sensible, más señales — adecuado para scalping o trading activo.
- Longitud de Oscilación Alta (14–20): Menos señales, pero de mayor calidad — adecuado para swing trading o trading de posición.
- Aumentar Multiplicador ATR en mercados altamente volátiles (por ejemplo, criptomonedas) para evitar cambios falsos.
- Disminuir Multiplicador ATR en mercados estables y con tendencia para señales más ajustadas.
- Mejor usado con confirmación de tendencia de marcos temporales superiores.
Swing Flow — Donde la estructura del mercado se encuentra con la claridad de la tendencia.


![Logotipo de "[Stellar Strategies] Moving Averages Combined 1.0"](https://cdn.ctrader.com/image/webp/93692c9d-ac16-4dd8-ba83-5a62250c39a9_27250)


