
Mô tả
Chỉ Báo Phá Vỡ Biến Động - Động Cơ Biến Động Hawkes
Chỉ báo này nhằm cung cấp bối cảnh, không phải hành động giao dịch ngay lập tức. Thành phần biến động giúp bạn biết khi nào điều kiện thị trường đang thay đổi - các giai đoạn biến động thấp thường báo trước các chuyển động lớn, và các giai đoạn biến động cao cuối cùng sẽ tự cạn kiệt. Thành phần EWMA giữ cho bạn định hướng với xu hướng đang phát triển và làm nổi bật khi giá kéo ra xa khỏi nó.
Kết hợp hai góc nhìn này - chế độ biến động và bối cảnh xu hướng - với phương pháp giao dịch và phán đoán của riêng bạn. Chỉ báo cho bạn thấy môi trường - bạn quyết định làm gì trong đó.
Phiên bản 2.0
Mở cho các cập nhật trong tương lai
-----------------------------------------------------------------------------------------------------------------------------------------------------------------------
Tổng quan
-----------------------------------------------------------------------------------------------------------------------------------------------------------------------
Chỉ báo này kết hợp hai thành phần riêng biệt để giúp nhà giao dịch xác định chế độ biến động và điều kiện xu hướng đồng thời.
Thành phần đầu tiên sử dụng Quá trình Hawkes để phát hiện sự thay đổi trong biến động thị trường. Khác với các chỉ báo biến động truyền thống, nó không dự đoán hướng đi—nó chỉ báo hiệu khi thị trường chuyển từ giai đoạn nén yên tĩnh sang biến động hoạt động, hoặc ngược lại. Hãy coi nó như một bộ phát hiện trạng thái biến động: nó cho bạn biết khi nào mọi thứ đang nóng lên hoặc nguội đi, nhưng không cho biết giá sẽ di chuyển theo hướng nào.
Thành phần thứ hai thêm một hệ thống EWMA kép (Trung bình trượt trọng số mũ) phủ lên biểu đồ giá của bạn. Điều này cung cấp bối cảnh xu hướng bằng cách sử dụng giao cắt trung bình nhanh và chậm, với một lớp tô màu nến bổ sung để hiển thị khi giá lệch khỏi xu hướng.
-----------------------------------------------------------------------------------------------------------------------------------------------------------------------
Cách hoạt động
-----------------------------------------------------------------------------------------------------------------------------------------------------------------------
Phát hiện biến động: Chỉ báo sử dụng bộ ước lượng Biến động Cao-Thấp Parkinson — một phương pháp hiệu quả hơn so với ATR tiêu chuẩn vì nó sử dụng toàn bộ phạm vi thanh. Biến động được chuẩn hóa này được đưa vào tính toán Quá trình Hawkes, sau đó được so sánh với các ngưỡng dựa trên phân vị động.
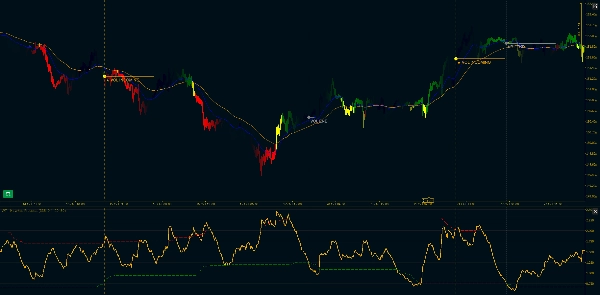
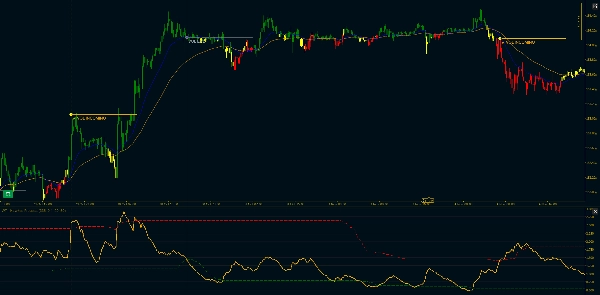
Khi biến động vượt lên trên ngưỡng trên sau một giai đoạn nén, bạn nhận được tín hiệu "VOL INCOMING". Khi nó giảm xuống dưới ngưỡng dưới, bạn thấy "VOL END". Đây không phải là tín hiệu vào lệnh—chúng là sự thay đổi chế độ biến động. Thị trường hoặc đang thức dậy hoặc đang đi vào giấc ngủ.
Bối cảnh xu hướng: Hai đường trung bình trượt trọng số mũ (Nhanh và Chậm) xuất hiện trên biểu đồ chính của bạn. MA Nhanh màu xanh dương, MA Chậm màu cam. Khi Nhanh nằm trên Chậm, xu hướng tăng. Khi Nhanh nằm dưới Chậm, xu hướng giảm.
Bộ lọc lệch: Đây là phần thú vị. Đôi khi giá kéo ra xa xu hướng đáng kể. Khi toàn bộ cây nến (mở, cao, thấp, đóng) nằm dưới MA Nhanh trong xu hướng tăng, hoặc trên nó trong xu hướng giảm, thanh nến chuyển sang màu vàng. Đây là bộ lọc nghiêm ngặt—nếu ngay cả bấc nến chạm MA Nhanh, nó vẫn giữ màu xu hướng bình thường.
Các thanh vàng thường xuất hiện tại các điểm hồi hoặc điểm kiệt sức, nhưng hãy nhớ: chúng không cho bạn biết điều gì sẽ xảy ra tiếp theo, chỉ là giá tạm thời tách khỏi đường xu hướng.
-----------------------------------------------------------------------------------------------------------------------------------------------------------------------
Tính năng chính
-----------------------------------------------------------------------------------------------------------------------------------------------------------------------
Thành phần biến động:
- Chuẩn hóa Biến động Cao-Thấp Parkinson (hiệu quả hơn phương pháp ATR tiêu chuẩn)
- Tính toán Quá trình Hawkes với độ suy giảm điều chỉnh được (tham số Kappa)
- Ngưỡng dựa trên phân vị động (các phần trăm có thể tùy chỉnh)
- Các dấu hiệu trực quan: "VOL INCOMING" tại các điểm phá vỡ biến động, "VOL END" tại các điểm nén
- Lọc tiếp tục: chỉ đánh dấu lần phá vỡ đầu tiên, không phải mọi đỉnh
- Tùy chọn đường xu hướng ngang và dấu hiệu dọc
Thành phần xu hướng EWMA:
- Tính toán EWMA tương thích với Pandas (công thức adjust=True)
- Đường MA Nhanh và Chậm hiển thị trên biểu đồ giá chính
- Độ dài chu kỳ có thể tùy chỉnh (mặc định: 20/50)
- Hỗ trợ số kỳ tối thiểu (ngăn xuất dữ liệu cho đến khi đủ dữ liệu)
- Tùy chọn bỏ qua NA để xử lý khoảng trống
- Hệ thống nến ba màu: Xanh lá (xu hướng tăng), Đỏ (xu hướng giảm), Vàng (lệch hướng)
Tùy chọn tùy chỉnh:
- Chu kỳ Parkinson (khoảng nhìn lại để tính biến động)
- Hawkes Kappa (tốc độ suy giảm, ảnh hưởng đến độ nhạy)
- Chu kỳ nhìn lại phân vị
- Ngưỡng biến động thấp và cao (các phần trăm)
- Chuyển đổi hàng năm và độ dài đoạn
- Chu kỳ Nhanh và Chậm cho các trung bình trượt
- Màu sắc Tăng, Giảm và Lệch
- Độ dài mở rộng đường xu hướng
- Hiển thị/ẩn các dấu hiệu dọc
----------------------------------------------------------------------------------------------------------------------------------------------------------------------------
Ghi chú kỹ thuật: Thành phần Quá trình Hawkes sử dụng phép tính mũ đệ quy được tối ưu hóa cho sử dụng thời gian thực. Việc triển khai EWMA khớp với hành vi của Pandas để đảm bảo nhất quán với kiểm thử lại dựa trên Python. Cả hai thành phần chỉ tính toán trên các thanh đã đóng để tránh vẽ lại.
Tóm tắt
Đánh giá của khách hàng
5 | 100 % | |
4 | 0 % | |
3 | 0 % | |
2 | 0 % | |
1 | 0 % |


![Logo "[CB] Pivot Points Pro"](https://cdn.ctrader.com/image/webp/43463c82-67b0-4f10-a4ba-901bba091d81_32594)


