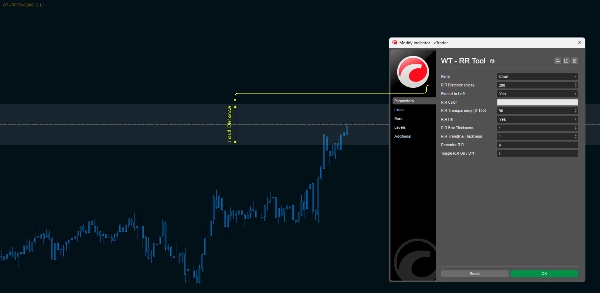
Broker & Prop
Untuk bisnis
00
Days
:
00
Hours
:
00
Minutes
:
00
Seconds
Indikator
NAS100
NZDUSD
XAUUSD
Commodities
Forex
Signal
EURUSD
GBPUSD
BTCUSD
Indices
Prop
Stocks
Crypto
USDJPY
WT - RR Tool
01/12/2025
1
Desktop
Sejak 13/01/2025
Volume trading
15.57M
Pip dimenangkan
31.83K
Penjualan
12
Instal gratis
8
Gambar unggahan "WT - RR Tool"

Lightweight Risk-Reward Visualization Tool


Version 1.0 Release Notes

Adjustable R:R Pips Size - 1:1 RR
Hotkey functionality
0.0
Ulasan: 0
Ulasan pelanggan
Belum ada ulasan untuk produk ini. Sudah mencobanya? Jadilah pemberi ulasan pertama!
Produk lain dari penulis ini
Indikator
NAS100
NZDUSD
XAUUSD
+13
WT - AMPLiTUDE - TRIAL - 01
Amplitude Momentum Optimizer — FREE TRIAL Version to Find Out If the Complete Indicator Has a Real Edge.
Indikator
NAS100
NZDUSD
XAUUSD
+12
WT - Amplitude - Momentum Detection
Experience a new approach with amplitude-based momentum analysis. Smart Trend Detection That Adapts to Market Volatility
cBot
NAS100
Indices
Prop
+9
WT - Hotkeys - Trade Panel
Turn Your Keyboard into a Trading Console — Instant Entries, Exits, and Precision Risk Control.
Indikator
NAS100
NZDUSD
XAUUSD
+12
WT - PJER
Price Jump Exit & Re-Entry Indicator - Statistical boundaries that adapt to real-time volatility.
Indikator
NAS100
NZDUSD
Breakout
+14
WT - Tick Imbalance Bars
Tick Imbalance Bars Indicator - brings institutional-grade market microstructure analysis to cTrader.
Indikator
NAS100
NZDUSD
Breakout
+12
WT - Composite Index
Combines multiple Currency Pairs / Symbols into a single Weighted Average Strength of that currency.
Indikator
NAS100
Breakout
XAUUSD
+12
WT - Tick Volume Bars
Volume Imbalance Bars Indicator - brings institutional-grade market microstructure analysis to cTrader.
Indikator
NAS100
NZDUSD
XAUUSD
+11
WT - Volume Delta
Delta Volume Indicator - Advanced Order Flow Analysis for cTrader
Indikator
NAS100
NZDUSD
XAUUSD
+12
WT - Hawkes Process
Identifies market compression zones and explosive Breakout moments using mathematical modeling.
Anda mungkin juga suka
mIntrinsicRecursiveValue
Intrinsic Recursive Value Indicator
VegaXLR - Fibonacci Bands
Customizable Dynamic Fibonacci Channels and Smart Alerts
VegaXLR - cTrader Multi-Timeframe Pivot Pro
Customizable multi-timeframe pivot point indicator for cTrader with alerts, Fibonacci, CPR, and more!
Indikator
Indices
Breakout
XAUUSD
+8
Phoenix Zones
Phoenix Zones - Detector de Reversiones Críticas
Indikator
Indices
Prop
Stocks
+3
Higher Timeframe Candlestick
Overlay a real-time higher-timeframe candle on your chart — color-coded bias without switching TFs.
Peringkat teratas
Gratis
BarCount
Bar count
MA Sabres
Conquer the markets with MA Sabres! This indicator spots trend flips with MAs and cool Sabre shapes & alerts.
Fibonacci Prediction Channel
Designed to plot a future prediction channel based on Fibonacci retracement levels 📊
Price Speed or Acceleration v1
This Indicator will display either the speed or the acceleration of the current symbol.
Head Shoulders Finder
Detects Head & Shoulders patterns, plots signals, and alerts for trading opportunities.
Indikator
NAS100
NZDUSD
XAUUSD
+14
Volume Profile Pivot Anchored
Anchor volume profiles to pivots with POC, VAH, VAL and real-time insights for clearer trade decisions.
Indikator
Indices
Breakout
XAUUSD
+9
Market Bias Gauge
Measure Market Strength at a Glance – Instantly
Indikator
RSI
Breakout
XAUUSD
+5
Shielded Trend
Buy/Sell signals filtering noise, color-coded trends & strength shield 🛡️. Trade only with POWER ⚡
Vsamarth Indi
One‑click RSI robot for consistent rapid‑fire trades.
Indikator
NAS100
RSI
NZDUSD
+15
RSI + EMA Crossover Signals
Dual confirmation RSI + EMA crossover signals with visual alerts and dynamic ATR offsets.
Indikator
Indices
RSI
Prop
+4
SuperEmaColorRSI
This is a super indicator that integrates the RSI indicator with a dual moving average system.
Indikator
Grid
NAS100
NZDUSD
+13
Standard Deviation Channel
Visualize trends with Standard Deviation Channel! Display median, and add customizable upper/lower deviation channels.
Previous Day Liquidity Zones (PDH - PDL)
Useful indicator for traders who want to visualize key price levels based on previous daily highs and lows.