
Mô tả
Nhãn Động Lượng Biên Độ — Phát Hiện Xu Hướng Thích Ứng Dựa Trên Biến Động
Nhãn Động Lượng Biên Độ kết hợp nhiều khái niệm tiên tiến:
- Phát Hiện Chế Độ — Xác định các pha xu hướng thực sự
- Thích Ứng Biến Động — Tự điều chỉnh theo điều kiện thị trường hiện tại
- VWAP Động — Làm nổi bật các mức hồi lại và tiếp tục có ý nghĩa
- Ước Lượng Chênh Lệch Roll — Báo hiệu điểm vào lại tối ưu trong xu hướng
- MÔ-ĐUN TỐI ƯU HÓA — với Tính Năng Tự Tối Ưu**
Điều này tạo ra một chỉ báo thông minh, tự điều chỉnh, mang lại sự rõ ràng, khả năng thích ứng và các vùng giao dịch có thể hành động — mà không cần điều chỉnh thủ công liên tục.
Nó Là Gì?
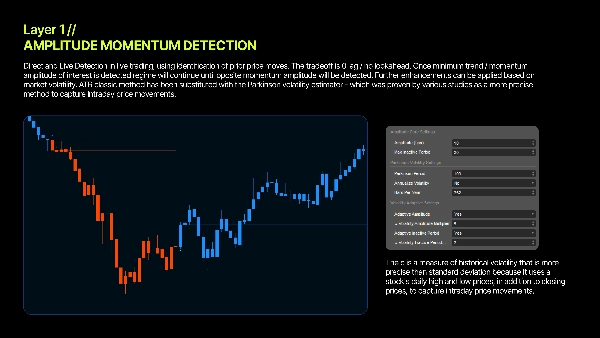
Nhãn Động Lượng Biên Độ là một chỉ báo phát hiện chế độ xác định khi nào thị trường bước vào hoặc rời khỏi các pha động lượng tăng hoặc giảm —theo thời gian thực.
Không giống như các giao cắt trung bình động truyền thống, nó đo lường sự thay đổi động lượng thực tế bằng cách đánh giá sự dịch chuyển giá và sức mạnh đảo chiều.
Câu Hỏi Cốt Lõi
Thị trường hiện đang trong pha động lượng hay không — và theo hướng nào?
Để trả lời điều này, chỉ báo theo dõi:
- Biên Độ — giá đã di chuyển bao xa;
- Trình Tự — thứ tự xuất hiện của các đỉnh và đáy.
Một chuyển động mạnh theo sau bởi một sự đảo chiều có ý nghĩa đánh dấu sự bắt đầu của một chế độ động lượng mới.
Cách Hoạt Động
1. Đo Độ Dao Động
Chỉ báo liên tục cập nhật các mức giá cao nhất và thấp nhất.
Hiệu số của chúng —biên độ— xác định kích thước dao động hiện tại của thị trường.
2. Phát Hiện Đảo Chiều
- Sự giảm mạnh theo sau bởi một đợt tăng mạnh → **Động lượng tăng**
- Sự tăng mạnh theo sau bởi một đợt giảm mạnh → **Động lượng giảm**
3. Xác Nhận Tính Quan Trọng
Chỉ những đảo chiều vượt ngưỡng điều chỉnh theo biến động mới kích hoạt tín hiệu hợp lệ.
4. Phát Hiện Sự Cạn Kiệt
Nếu giá ngừng tiến triển, chỉ báo xác định sự cạn kiệt động lượng và trở về trạng thái trung lập.
Biến Động Parkinson — Ngưỡng Thích Ứng
Hầu hết các chỉ báo sử dụng tham số cố định. Chỉ báo này tự động thích ứng. Bằng cách sử dụng Biến Động Parkinson— bao gồm phạm vi cao/thấp trong ngày — chỉ báo điều chỉnh độ nhạy dựa trên điều kiện thị trường thực tế. Kết quả: hiệu suất ổn định trong môi trường yên tĩnh và biến động. ( Được chứng minh thống kê hiệu quả hơn Phương Pháp ATR )
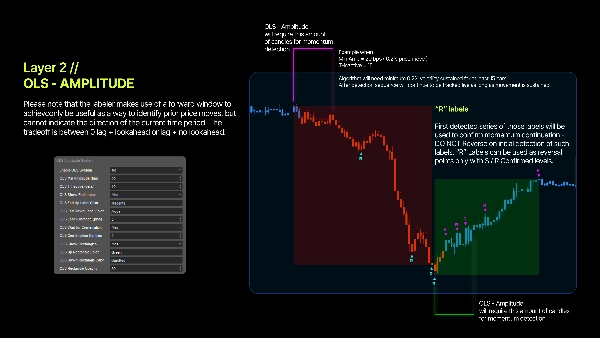
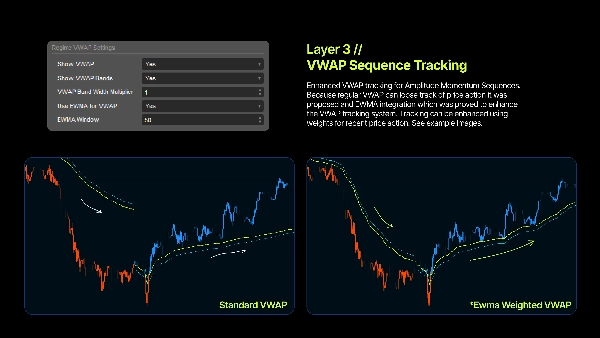
VWAP Chế Độ — Mức Động Cho Việc Vào Lại
Khi một chế độ đang hoạt động, chỉ báo tính toán VWAP đặc thù cho xu hướng đó, cung cấp Mức Hỗ Trợ Động và Mức Kháng Cự Động. Các tổ chức dựa nhiều vào VWAP, và giá thường phản ứng quanh nó — làm cho nó lý tưởng cho các điểm vào lại khi giá hồi.
Chế Độ EWMA
Bật EWMA để trọng số giá gần đây cao hơn, tạo ra đường cong VWAP mượt mà và phản ứng nhanh hơn. Tuyệt vời để xác định điểm vào lại trong các xu hướng kéo dài.
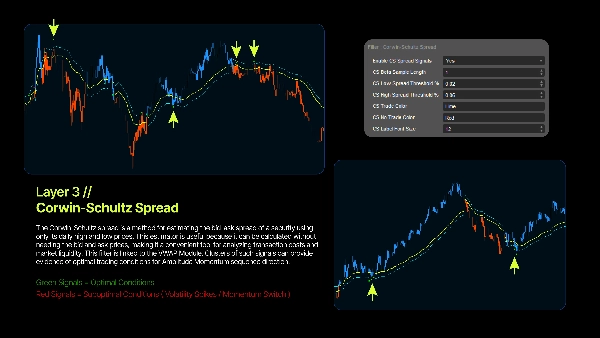
Ước Lượng Chênh Lệch Roll - Bộ Lọc Động Cho Việc Vào Lại
Ước lượng chênh lệch roll là một phương pháp ước tính chênh lệch giá mua/bán từ các giá giao dịch quan sát được, thường sử dụng hiệp phương sai nối tiếp của các biến động giá. Được phát triển bởi Roll, phương pháp này giả định rằng các giao dịch liên tiếp thay phiên nhau giữa giá mua và giá bán, và thông tin mới không liên tục làm thay đổi "giá thực". Mặc dù đơn giản và cơ bản, phương pháp gốc đã được cải tiến để giải quyết các vấn đề như thiên lệch giảm và hiệu suất kém trong một số bộ dữ liệu. Ước lượng dựa trên ý tưởng rằng nếu không có thông tin mới được phát hành, giá sẽ chỉ dao động giữa giá mua và giá bán. Nó giả định xác suất bằng nhau của giao dịch bắt đầu mua và giao dịch bắt đầu bán.
Lợi Ích Khi Sử Dụng
1. Xác Định Xu Hướng Khách Quan - Không cần đường xu hướng. Không đoán mò. Toán học xác định chế độ.
2. Thích Ứng Biến Động - Tự động điều chỉnh theo điều kiện thay đổi bằng cách sử dụng Biến Động Parkinson.
3. Vùng Vào Rõ Ràng - Mức VWAP chế độ giúp xác định chính xác các vùng hồi lại và bổ sung.
4. Ranh Giới Chế Độ Rõ Ràng - Biết chính xác khi nào động lượng bắt đầu và khi nào kết thúc.
5. Tương Thích Đa Khung Thời Gian - Chuẩn hóa điểm cơ sở đảm bảo hành vi nhất quán trên mọi biểu đồ.
Nền Tảng Định Lượng
Lợi Nhuận Logarit
Sử dụng lợi nhuận logarit đảm bảo tính đối xứng, làm cho việc đo lường động lượng trở nên vững chắc về mặt toán học.
Điểm Cơ Sở
Tất cả các phép tính sử dụng đơn vị bps chuẩn hóa (1 bps = 0,01%), cho phép sự nhất quán giữa các tài sản.
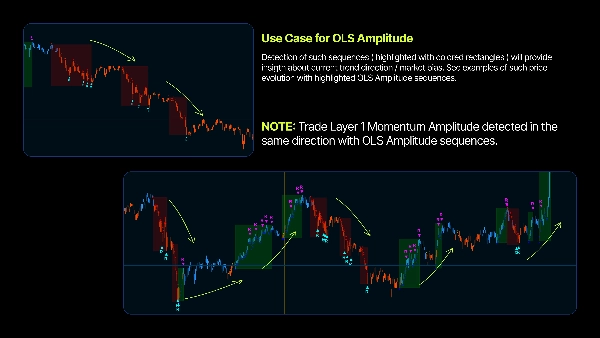
Phát Hiện Hồi Lại
Các sự thay đổi động lượng được xác định thông qua các chuyển động hướng mạnh theo sau bởi các chuyển động ngược có ý nghĩa (đảo chiều hình chữ V).
Khối Lượng Tổng Hợp
Khối lượng tổng hợp dựa trên phạm vi và thân nến đảm bảo độ chính xác của VWAP cho bất kỳ ký hiệu nào.
⎽⎽⎽⎽⎽⎽⎽⎽⎽⎽⎽⎽⎽⎽⎽⎽⎽⎽⎽⎽⎽⎽⎽⎽⎽⎽⎽⎽⎽⎽⎽⎽⎽⎽⎽⎽⎽⎽⎽⎽⎽⎽⎽⎽⎽⎽⎽⎽⎽⎽⎽⎽⎽⎽⎽⎽⎽⎽⎽⎽⎽⎽⎽⎽⎽⎽⎽⎽⎽⎽⎽⎽⎽⎽⎽⎽⎽⎽⎽⎽⎽⎽⎽⎽⎽⎽⎽⎽⎽⎽⎽⎽⎽⎽⎽⎽⎽⎽⎽⎽⎽⎽⎽⎽⎽⎽⎽⎽⎽⎽⎽⎽⎽⎽
Công cụ này chỉ dành cho mục đích giáo dục và thông tin. Nó không phải là lời khuyên đầu tư. Giao dịch có rủi ro, và thua lỗ có thể vượt quá số tiền gửi. Hiệu suất trong quá khứ không đảm bảo kết quả trong tương lai. Bạn hoàn toàn chịu trách nhiệm cho tất cả các quyết định giao dịch. Người tạo ra không chịu trách nhiệm về bất kỳ tổn thất tài chính nào phát sinh từ việc sử dụng chỉ báo. Luôn thực hiện phân tích riêng trước khi giao dịch.
Tóm tắt
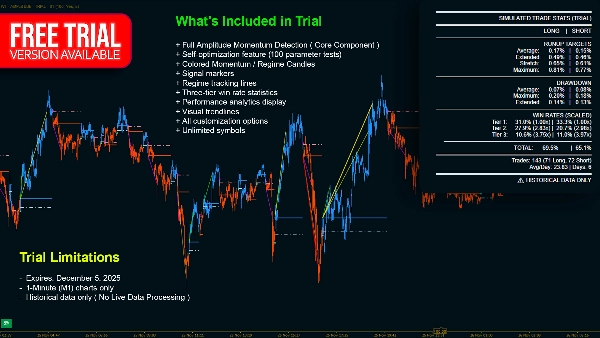
Key features include:
- **Regime Detection:** Pinpoints market entry and exit points for momentum trends.
- **Volatility Adaptation:** Uses Parkinson Volatility to self-tune sensitivity based on current market conditions, ensuring consistent performance across varying volatility.
- **Dynamic VWAP:** Calculates a volume-weighted average price specific to each trend regime, providing dynamic support and resistance levels for pullback and continuation entries.
- **Roll Spread Estimator:** Estimates bid-ask spreads to signal optimal re-entry points during trends.
- **Self-Optimization Module:** Automatically adjusts parameters without manual intervention.
The indicator operates by continuously tracking price extremes to measure swing amplitude, detecting significant reversals that exceed volatility-adjusted thresholds, and identifying momentum exhaustion when price progression stalls. It uses logarithmic returns and basis-point normalization for mathematically robust, cross-asset consistency. Synthetic volume calculations enhance VWAP accuracy across symbols.
This tool supports multiple markets including Forex, stocks, indices, commodities, and cryptocurrencies, and is compatible with various timeframes. It outputs visual signals and filters to assist traders in objective trend identification and clear entry zone determination.
Đánh giá của khách hàng
5 | 75 % | |
4 | 25 % | |
3 | 0 % | |
2 | 0 % | |
1 | 0 % |


