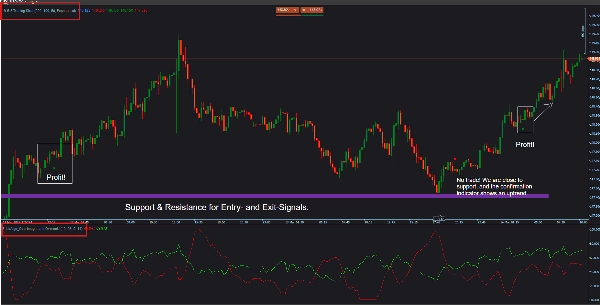
Nhà môi giới & tự doanh
Dành cho doanh nghiệp
00
Days
:
00
Hours
:
00
Minutes
:
00
Seconds
Chỉ báo
Signal
Scalping
9-5-3 Trading Strat
5.0
03/09/2025
358
Desktop
Kể từ 21/02/2025
Khối lượng đã giao dịch
458.47M
Pip đạt được
175.73K
Lượt bán
7
Cài đặt miễn phí
3866
Ảnh "9-5-3 Trading Strat" được tải lên

### For optimal trade confirmations, also use my free indicators, such as BrickAlgo_Overbought and Oversold. (1st Screenshot) ###

### Adjust the settings to match your trading style. Use small MAs for scalping in M1-M5 or larger MAs for M15 scalps, swing trading, etc. ###

The Larry Williams 9-5-3 Indicator brings the proven Moving Average strategy to the next level. This indicator precisely identifies buy and sell signals based on three exponential moving averages (MAs), helping you spot trends early and make informed trading decisions.

Key Features:
✔️ Three customizable MAs (9, 5, and 3 periods) for optimal trend analysis
✔️ Clear buy & sell signals to execute trades with confidence
✔️ Intuitive color coding – easy visualization of market movements
✔️ 100% compatible with cTrader – simple setup, no hassle

📈 How Does It Work?
👉 Buy Signal: MA(3) is above MA(5), and MA(5) is above MA(9) – a strong bullish trend!
👉 Sell Signal: MA(3) is below MA(5), and MA(5) is below MA(9) – a strong bearish trend!

🎯 Who Is This Indicator For?
Whether you're a day trader, swing trader, or long-term investor, the Larry Williams 9-5-3 Indicator helps you make smarter trading decisions!

💾 Download Now & Improve Your Trading Results!

📌 Available on the official cTrader website!

👉 Gain the Edge in Trading Today! 🔥

5.0
Đánh giá: 1
5
100 %
4
0 %
3
0 %
2
0 %
1
0 %
Đánh giá của khách hàng
August 12, 2025
Pros: Clear entry/exit signals, lightweight, customizable. Cons: No trend panel, no alerts, possible false signals in sideways markets.
Sản phẩm khác của tác giả này
Chỉ báo
RSI
Indices
Forex
+3
ScalpingSignals9000
High-probability trading signals in the fast-paced world of forex and CFD trading.
SmartArrows AI V2
High-Performance Renko Chart Indicator with Advanced AI Filtering.
Chỉ báo
RSI
Indices
Signal
Rsi + Volume
This indicator combines RSI (Relative Strength Index) with volume analysis to generate more reliable trading signals.
Phổ biến
$ 15
Chỉ báo
Indices
Prop
ATR
+4
TrendPulse
BrickAlgo TrendPulse is an advanced technical analysis tool that combines multiple indicators with filterin mechanisms.
Chỉ báo
Stocks
Forex
Signal
+1
Engulfing Pattern Indicator
Renko Moving Average Cross Indicator
The Renko Moving Average Cross indicator combines classic EMA crossover signals with Renko-filtered prices.
Chỉ báo
RSI
Signal
MA-RSI HTF Confirmation
MA-RSI HTF Confirmation: Eliminate false signals and trade with confidence!
Chỉ báo
Stocks
Forex
Crypto
PinBarCandlestickPattern
PinBarCandlestickPattern Indicator
EURUSD Breakout Indicator
Breakout Multi-Timeframe Strategy Indicator
Chỉ báo
Prop
Commodities
Stocks
+2
Light-Version BrickAlgo TrendPulse
🚀 Simplify Your Trading Decisions With Powerful Technical Analysis.
Hammer Pattern Indicator
Chỉ báo
Signal
MACD
USDJPY
PulseTracker
Version 1.2: Advanced Trend Detection & Visualization System
cBot
Forex
Signal
MACD
SwingStratH6
Smart Trend cBot - Swing6h
Chỉ báo
Forex
Signal
MACD
swingh6
Swing-Trading Indicaotr for pairs like EUR/USD, AUD/USD, and USD/JPY. Most effective on higher time frames H4,H6,H12...
ADX and ADI
This custom indicator is a complete implementation of the Average Directional Index and Directional Indicators.
Bạn cũng có thể thích
Fair Value Gap (Extended)
Detect FVGs with age, status, Fibonacci levels, and customizable fill threshold—extended version.
Chỉ báo
XAUUSD
Forex
EURUSD
+2
ALMA Smoothed Gaussian Moving Average
ALMA Smoothed Gaussian Moving Average (ASGMA) – by LudwigICT
Phổ biến
$ 15
Chỉ báo
Bollinger
JMA
Jurik Moving Average (Jurik's Moving Average) triple adaptive filter with unique Jurik smoothing and dynamic factor.
Simple MACD Histogram
Simple MACD Histogram with color-coded rising (green) and falling (red) momentum bars.
Chỉ báo
NAS100
Indices
NZDUSD
+9
Heatmap Pro
Heatmap Pro analiza la volatilidad, el volumen y la acción del precio para "pintar" tu gráfico con zonas de color.
Chỉ báo
XAUUSD
Commodities
ATR
+1
[Stellar Strategies] Visual Trend Momentum
Visual Trend Momentum is a MA/ATR/Volume trend tool. Visual signals for strong trends & reversals. Customizable. 📈📉
Chỉ báo
Grid
NAS100
RSI
+16
Smart Money Breakout Channels
Smart Money Breakout Channels – Auto-detect breakout zones with price, volume & volatility insights on cTrader.
Chỉ báo
NAS100
NZDUSD
XAUUSD
+12
WT - Hawkes Process
Identifies market compression zones and explosive Breakout moments using mathematical modeling.
Chỉ báo
NAS100
NZDUSD
RSI
+11
RSI Channel Trigger
🧠Visually marks momentum zones when the RSI crosses the overbought/oversold thresholds (default 70/30). ✅
Chỉ báo
Indices
Stocks
Commodities
+2
Series - FXMaster
Consecutive Series Moves — Reveal the True Pulse of Price Action
Chỉ báo
Grid
NAS100
NZDUSD
+19
Market Strutture Signal Pro
MarketStructureOscSignals is a pure price-action signal tool.
Chỉ báo
Indices
Breakout
Supertrend
[CB] Pivot Points Pro
You can use the cTrader Pivot Points Pro indicator to find a good pullback entry in a trend
FX Market Sessions
Easily visualise Forex sessions with start/end markers and high/low levels for Sydney, Tokyo, London, and New York.
MM-Symbol Info (free)
Enhance the trading experience with real-time Spread, Time To Close, rPNL, uPNL, PNL and minimalistic Bid / Ask lines
Chỉ báo
RSI
EURUSD
MACD
Supply&Demand
Precision Supply & Demand zones indicator—automatically plots key buy/sell areas on your chart for smarter entries.
Chỉ báo
Indices
Breakout
XAUUSD
+9
IBS Indicator
IBS Indicator – Measures price position within bars for smarter trades. Works on all markets & timeframes.
Chỉ báo
NAS100
NZDUSD
XAUUSD
+11
Samurai Breakout Lite
⚔️Limited version. Draws clean session box (Tokyo / London / New York / Overlap) and optional breakout plan (EP/TP/SL)⚔️
Chỉ báo
Breakout
XAUUSD
Forex
+2
McDonalds Pattern-Bzier Curve
Designed to identify and visualize price reversal patterns using Bézier curves.