
Deskripsi
1. Apa itu Hyper Trend dan untuk siapa
Hyper Trend adalah indikator overlay pengikut tren untuk c Trader. Ini memberikan Anda satu garis tren trailing yang mudah dibaca, zona referensi untuk bergabung dengan tren tersebut, penanda sinyal yang jelas, framing stop-loss / take-profit opsional di grafik, dan sebuah panel interaktif sehingga Anda dapat menyesuaikan sebagian besar yang Anda lihat secara langsung, tanpa membuka pengaturan kembali.
Tujuan desainnya sengaja sederhana: mengambil metode trading yang sudah mapan dan menghasilkan tren serta sinyal yang benar-benar mudah dibaca — kemudian membuat keseluruhannya ringan, tidak mengganggu, dan cepat untuk diatur.
Cocok untuk semua jenis trader, tanpa memandang pengalaman.
-
-
- Pemula mendapatkan bacaan yang bersih tentang arah dan risiko.
- Trader berpengalaman mendapatkan overlay yang cepat dan dapat dikonfigurasi yang tidak mengganggu pembacaan harga mereka sendiri.
-
Ini dibangun agar sederhana dan efisien di permukaan sementara didasarkan pada aplikasi yang diteliti di bawahnya, dan mudah untuk diatur dan disesuaikan.
"Apapun yang Anda perdagangkan dan seberapa berpengalaman Anda, Hyper Trend dimaksudkan untuk mudah dibaca, mudah diatur, dan mudah disesuaikan."
2. Ide di baliknya
Rata-rata bergerak, ATR, Super Trend, filter perataan — ini adalah metode yang sudah dikenal dan mapan
, dan mereka ada tepat untuk melakukan apa yang Hyper Trend lakukan: mengubah harga mentah menjadi tren yang dapat dibaca dengan sinyal yang berguna.
Jadi mengapa alat lain? Karena dalam praktiknya, sebagian besar indikator di ruang ini memiliki masalah yang sama:
-
-
- Pengemasan ulang. Sebagian besar yang dipublikasikan adalah logika yang sama atau lama, diberi nama ulang dan
dirilis ulang berulang kali, dengan sedikit hal baru yang benar-benar asli di bawahnya. - Kekacauan grafik. Banyak yang menumpuk begitu banyak di grafik sehingga membaca harga itu sendiri menjadi hampir
tidak mungkin, dan logika internal mereka terkadang bertentangan dengan niat sebenarnya trader. - Keunggulan yang memudar. Konsep dasar terdengar bagus, tetapi di pasar yang berkembang cepat saat ini — terutama pada timeframe yang lebih cepat — mereka sering gagal mempertahankan keunggulan nyata.
- Pengemasan ulang. Sebagian besar yang dipublikasikan adalah logika yang sama atau lama, diberi nama ulang dan
-
Hyper Trend berusaha melawan ketiganya. Ini mempertahankan tulang punggung yang sudah mapan (perataan,
pita volatilitas, arah gaya Super Trend) tetapi menerapkan pendekatan baru untuk pra-pemrosesan data, perataan harga, dan penanganan sinyal — jenis teknik yang dibahas
dalam makalah ilmiah, jurnal trading, dan penelitian akademis. Semua tautan referensi dapat ditemukan di deskripsi video.
REFERENSI SUMBER
- ECB: A TREND-CYCLE(-SEASON) FILTER
- Kalman filter demystified: from intuition to probabilistic graphical model to real case in financial markets
- Financial Pricing Models in Continuous Time and Kalman Filtering
- The Holt-Winters filter and the one-sided HP filter: A close correspondence
- A Bayesian Framework for Trend and Seasonality Decomposition
- Hedge Fund Returns, Kalman Filter, and Errors-in-Variables
- Moving Averages for Financial Data Smoothing
- Optimizing the Performance of the Fractal Adaptive Moving Average Strategy: The Case of EUR/USD
- Kalman Filter and Optimal Smoothing Derived by the Regression Model
Tujuannya adalah untuk menguji pertanyaan sederhana dalam praktik: apakah konsep teoretis ini,
yang diterapkan di atas alat yang sudah mapan, dapat membawa keunggulan nyata kembali ke pihak trader? Hyper Trend adalah
salah satu contoh konkret dari upaya tersebut — metode yang sudah mapan, dimodernisasi di bagian yang penting, dengan
keterbacaan diperlakukan sebagai fitur utama bukan sekadar pemikiran tambahan.
"Dasar yang sama yang dipercaya — perataan, volatilitas, logika tren — tetapi dengan
pra-pemrosesan modern dan fokus tanpa henti untuk menjaga grafik tetap terbaca."
3. Poin utama — apa yang membuatnya berbeda
Overlay yang tidak mengganggu, secara desain. Ini menjaga keseimbangan yang disengaja antara menampilkan apa yang benar-benar berguna di atas harga dan tidak mengubah aliran harga yang Anda baca.
Dioptimalkan untuk c Trader — cepat dan ringan. Dirancang untuk pemuatan cepat dan penggunaan CPU rendah, dan dirancang untuk berjalan lancar bahkan dengan beberapa instance yang terpasang dan berjalan bersamaan, di beberapa grafik atau simbol, sehingga platform Anda tetap responsif.
Alur kerja yang bersih di balik layar.
-
-
- Pilih sumber harga. Anda memilih harga mana yang akan digunakan untuk perhitungan — penutupan, titik tengah seperti HL2, harga tipikal seperti HLC3, dan sebagainya (pengaturan sumber).
- Pra-pemrosesan opsional. Anda dapat mengalirkan harga tersebut melalui lilin Heikin-Ashi dan/atau filter Kalman sebelum hal lain, untuk meratakan deret yang berisik — ini adalah bagian dari
ide "pemrosesan yang dimodernisasi". - Dasar tren yang diratakan. Sumber yang dipilih diratakan untuk membentuk dasar tren yang menjadi dasar logika lainnya — dirancang untuk melacak pergerakan dominan.
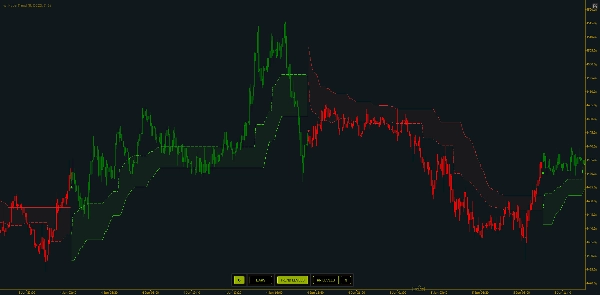
- Pita volatilitas. ATR yang diratakan dengan Wilder menetapkan pita di atas dan di bawah dasar tersebut.
- Logika SuperTrend. "Kelekatan" SuperTrend standar kemudian menentukan sisi mana yang aktif:
dalam tren naik pita bawah menjadi garis trailing; dalam tren turun pita atas yang berlaku. Ketika harga menutup melewati pita aktif, tren berbalik.
-
"Ini dibuat agar ringan di grafik — menunjukkan apa yang membantu, menyembunyikan apa yang
tidak, dan tidak pernah menghalangi harga itu sendiri. Satu klik pada panel membawa Anda kembali ke
harga bersih kapan pun Anda mau."
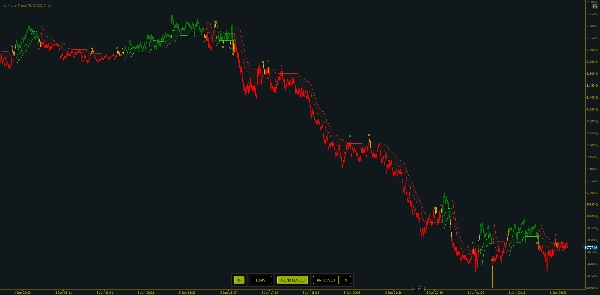
4. Membaca grafik — visual inti
1. Garis trailing
-
- Hijau = tren naik (garis di bawah harga)
- Merah = tren turun (garis di atas harga)
- Perubahan warna adalah pergantian tren
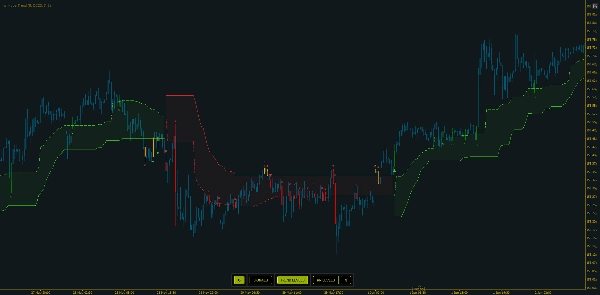
2. Zona masuk
-
- Saat diaktifkan, level titik-titik berada sebagian kecil dari garis trailing menuju pita yang berlawanan — referensi "tarikan kembali ke nilai" di dalam tren saat ini, bukan mengejar ekstrem.
Entry Zone Distancemengontrol seberapa jauh level tersebut berada.
3. Pewarnaan bar
-
- Bar dapat diwarnai berdasarkan arah aktif, dengan tiga gaya:
-
- Reguler (bull/bear berdasarkan arah),
- Mode 1, memberikan visualisasi berbeda pada fase transisi
- Mode 2, yang juga menandai bar transisi/ netral.
Garis trailing hijau/merah yang terlihat adalah output akhir. Semua yang lain — zona masuk, penanda, garis SL/TP, pewarnaan bar — ditempatkan di atas status arah yang sama.
"Warna garis adalah bias rezim Anda sekilas; zona titik-titik adalah tempat tren menawarkan entri yang lebih masuk akal."
5. Sinyal dan Peringatan
Hyper Trend membedakan tiga jenis sinyal. Setiap sinyal mencetak penanda berlabel pada bar yang dikonfirmasi dan dapat diaktifkan secara independen:
-
- Sinyal pergantian (aktif secara default) — dipicu saat arah pergantian tren (atau bias). Ini adalah sinyal utama.
- Sinyal masuk silang — dipicu pada silang pulang-pergi yang tervalidasi dari zona masuk dalam tren yang ada (harga meninggalkan dan merebut kembali zona). Untuk timing entri pullback.
- Sinyal silang tren — dipicu pada silang pulang-pergi yang tervalidasi dari garis trailing itu sendiri. Dalam mode pewarnaan yang lebih kaya, silang garis tren pada bar transisi/netral diperlakukan sebagai penanda keluar bukan entri baru.
- Sinyal keluar — terlihat saat Pewarnaan Bar - Mode 2 diaktifkan, sinyal ini dapat membantu menandai saat tren kehilangan kekuatannya dan beberapa bar sebelum sinyal pergantian. Ini berguna untuk mengenali periode volatilitas rendah dengan partisipasi pasar yang menurun yang menghasilkan aksi harga yang terpotong atau terbatas dalam rentang.
Peringatan: saat diaktifkan, Hyper Trend memutar suara yang dipilih dan menampilkan popup untuk setiap sinyal yang terdeteksi. Peringatan mengikuti toggle yang sama — hanya jenis sinyal yang Anda aktifkan yang akan memberi peringatan — dan tombol peringatan pada panel di grafik mengaktifkan/mematikan mereka secara langsung. Popup singkat: simbol dan timeframe, jenis sinyal dan arah, serta harga saat ini.
"Mulailah hanya dengan sinyal pergantian untuk grafik yang bersih, lalu tambahkan sinyal silang saat Anda menginginkan timing entri yang lebih halus. Masing-masing dapat memberi Anda suara dan popup."
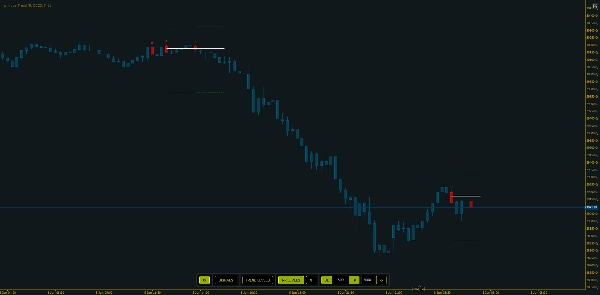
6. Rencanakan perdagangan Anda — level Risiko / Imbalan di grafik
Dengan level Stoploss / Target aktif, setiap bar sinyal mendapatkan tiga garis horizontal pendek: sebuah garis Entri pada harga tengah bar sinyal, sebuah garis SL pada jarak pip tetap di sisi kerugian, dan sebuah garis TP pada jarak pip tetap di sisi keuntungan.
Level-level tersebut diperpanjang sebelumnya oleh sejumlah bar tetap dan tidak terus bertambah setelahnya — sebuah snapshot pada sinyal. Sinyal baru memotong set sebelumnya sehingga level tidak saling tumpang tindih. Entri, SL, dan TP masing-masing memiliki warna sendiri, dengan lebar dan gaya garis yang dapat disesuaikan.
"Ini membingkai perdagangan secara visual — entri, stop, target — sehingga Anda melihat risiko-imbalan sebelum berkomitmen, lalu menjaga grafik tetap rapi dengan membatasi berapa banyak set yang bertahan."
7. Panel interaktif — ubah visual secara langsung
Panel di grafik mengubah apa yang ditampilkan seketika, tanpa membuka parameter kembali.
Toggle aktif disorot; panel selalu mencerminkan status saat ini. Anda memiliki beberapa opsi untuk menempatkannya di grafik, atau menyembunyikannya sepenuhnya.
"Semua yang biasanya Anda gali di pengaturan — pewarnaan, level tren, garis risiko, dan jarak SL/TP — ada satu klik di panel. Ketik jarak baru, tekan refresh, dan level diperbarui."
8. Pendekatan trading — beberapa contoh
Pendekatan A — Trading pergantian (mengikuti tren). Gunakan sinyal pergantian sebagai petunjuk utama Anda: masuk ke arah baru pada pembalikan yang dikonfirmasi, dan anggap garis trailing sebagai invalidasi visual Anda. Pembalikan kembali ke warna berlawanan adalah keluar/balik. Bacaan paling sederhana dan paling bersih.
Pendekatan B — Entri pullback di dalam tren. Dengan tren yang sudah terbentuk, tunggu harga menarik kembali ke zona masuk dan aktifkan sinyal silang masuk sehingga silang ulang menandai saat harga merebut kembali zona — bergabung dengan tren pada nilai yang lebih baik daripada mengejar ekstrem.
Pendekatan C — Risiko yang dibingkai pada setiap setup. Aktifkan Level RR, atur jarak SL / TP yang sesuai dengan volatilitas simbol. Anda melihat entri / stop / target sebelum berkomitmen, dan mengelola perdagangan Anda sesuai.
Di ketiga pendekatan tersebut, benang merahnya adalah penilaian: bertindak sesuai arah tren, konfirmasi dengan aksi harga di sekitarnya, dan gunakan garis sebagai referensi Anda — Hyper Trend adalah bacaan, Anda yang menempatkan dan mengelola perdagangan.
"Trading pembalikan, atau tunggu pullback ke zona, atau bingkai setiap setup dengan garis risiko — pilih pendekatan yang sesuai dengan cara Anda trading. Pahami konteks pasar dan gabungkan dengan alat lain seperti RSI atau MACD, temukan divergensi. Kombinasi itu adalah tempat ia memberikan hasil."
9. Cara mengevaluasinya
Pemeriksaan praktis: gulir kembali melalui sejarah dan lihat apakah garis tren menjaga Anda di sisi yang benar dari pergerakan berkelanjutan dan di mana pembalikan terkonsentrasi; bandingkan dua pengaturan berdampingan (misalnya pengali ATR berbeda atau lookback tren) untuk melihat trade-off responsivitas vs kelancaran; tinjau frame SL/TP secara historis untuk mengukur seberapa sering target tercapai sebelum stop pada jarak yang Anda pilih; cocokkan dengan pasar (tren jelas vs rentang ketat); dan perhatikan waktu — ini mengidentifikasi rezim terbaiknya saat pasar benar-benar bergerak, jadi bandingkan jam aktif dengan periode tenang, di luar jam sibuk.
"Evaluasi dengan menggulir sejarah dan membandingkan pengaturan — seberapa bersih pembalikan, seberapa baik zona masuk mengatur waktu pullback, dan bagaimana frame SL/TP menyelesaikan?"
10. Keterbatasan & catatan lain
Hyper Trend dibangun agar di atas kualitas indikator generik yang dikemas ulang — tetapi ini adalah alat, bukan bola kristal:
-
- Masih bisa menghasilkan sinyal palsu. Bertindak pada setiap sinyal secara mekanis tidak akan menghasilkan hasil positif sendiri.
- Menghargai keterampilan dan konteks. Ini mengasumsikan kemampuan dasar membaca harga dan pemahaman pasar sekitar. Digabungkan dengan konteks itu dan manajemen uang yang baik, ini menjadi alat yang benar-benar kuat — dan kombinasi itulah yang cenderung menghasilkan hasil positif dalam jangka panjang.
- Terbaik saat pasar bergerak. Bacaan yang diambil saat periode tenang, atau sepenuhnya di luar jam perdagangan reguler, kehilangan sebagian kualitas itu.
- Alat tren tertinggal dan berfluktuasi. Seperti pendekatan gaya SuperTrend lainnya, pembalikan bisa datang terlambat dan terkonsentrasi dalam rentang; perataan dan pita ATR mengurangi ini tapi tidak menghilangkannya.
- Garis SL/TP adalah alat perencanaan, bukan jaminan. Referensi pip tetap dari titik tengah bar sinyal; tidak memperhitungkan spread, slippage, atau pengisian aktual Anda, dan tidak mengikuti harga.
"Bawa pembacaan harga dasar, konteks pasar, dan manajemen uang, dan ini menjadi benar-benar kuat dalam jangka panjang — paling kuat saat pasar bergerak."
HyperTrend disajikan sebagai overlay yang bersih dan tidak mengganggu dengan timing entri bawaan, sinyal yang jelas, framing risiko di grafik, dan panel kontrol langsung. Mudah digunakan, ringan di cTrader, dan ditujukan untuk semua trader, pada simbol atau timeframe apa pun.
"Mudah diatur, ringan dijalankan, dan dibuat untuk membantu setiap trader membaca tren, menandai entri dan keluar, serta membingkai risiko — tetap bersih dan mudah dibaca."
Ringkasan
Under the hood, HyperTrend processes price data through selectable sources and optional smoothing filters such as Heikin-Ashi and Kalman filters. It applies volatility bands based on ATR and SuperTrend logic to determine active trend direction. The indicator offers three types of signals—trend switches, entry zone crosses, and trailing line crosses—with labeled markers and optional alerts via sound and popups.
Risk management is supported through on-chart stop-loss and take-profit levels displayed as horizontal lines at fixed pip distances from entry points, helping traders visualize risk/reward before committing. An interactive on-chart panel allows live adjustment of visual settings and parameters without reopening menus.
HyperTrend is optimized for fast, low-CPU performance on cTrader, suitable for all trader experience levels, and applicable across symbols and timeframes. It emphasizes readability and simplicity while incorporating modern data processing techniques to enhance traditional trend-following methods.


