
Volume Profile Pro
อินดิเคเตอร์
8 การซื้อ
เวอร์ชัน 1.0, Oct 2025
Windows, Mac
5.0
รีวิว: 3
คำอธิบาย
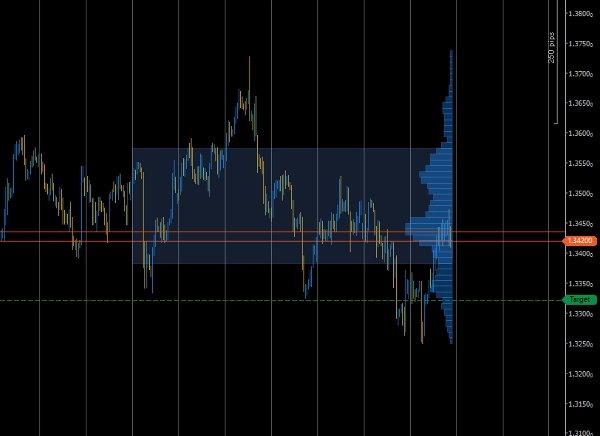
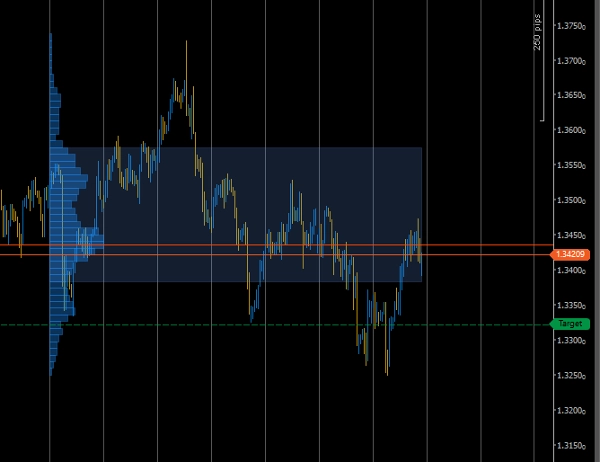
Volume Profile Pro เป็นเครื่องมือวิเคราะห์ปริมาณในช่วงเวลาคงที่ระดับมืออาชีพที่ออกแบบมาเพื่อการทำแผนที่โครงสร้างตลาดและสภาพคล่องอย่างแม่นยำ
ช่วยให้คุณมองเห็นกิจกรรมการซื้อขายที่เกิดขึ้นในแต่ละระดับราคาในช่วงแผนภูมิที่กำหนด — ช่วยให้คุณระบุโซนที่น่าสนใจได้ทันที เช่น โหนดปริมาณสูง, จุดควบคุม (POC) และพื้นที่มูลค่า 70%
คุณสมบัติหลัก
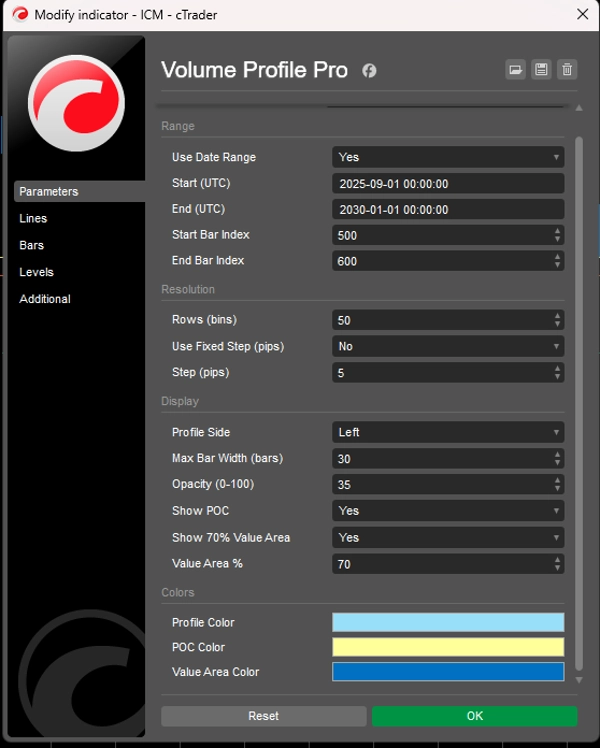
- 🧭 การเลือกช่วงเวลาคงที่ – กำหนดช่วงเวลาที่กำหนดเองโดยวันที่หรือดัชนีแท่งเพื่อวิเคราะห์เฉพาะพื้นที่ที่คุณสนใจ
- 📊 การแจกแจงปริมาณที่แม่นยำ – สร้างฮิสโตแกรมปริมาณจากปริมาณติ๊กในช่วงที่เลือก
- 🎯 POC & พื้นที่มูลค่า – เน้นจุดควบคุมและแถบพื้นที่มูลค่า 70% โดยอัตโนมัติ
- ⚙️ ความละเอียดที่ยืดหยุ่น – ปรับจำนวนบ็อกซ์หรือขั้นตอนคงที่ในหน่วยพิปส์เพื่อความละเอียดที่กำหนดเอง
- 🎨 การแสดงผลที่สะอาดตา – เลือกด้าน (ซ้าย/ขวา), การปรับขนาดความกว้าง และความทึบแสงเพื่อความอ่านง่ายของแผนภูมิที่ดีที่สุด
- ⚡ น้ำหนักเบา & ปรับแต่งประสิทธิภาพ – การคำนวณที่มีประสิทธิภาพสำหรับการศึกษาปริมาณแบบเรียลไทม์โดยไม่ทำให้เทอร์มินัลของคุณช้าลง
วิธีการทำงาน
- เลือกว่าจะใช้ ช่วงวันที่ หรือ ช่วงดัชนีแท่ง.
- กำหนดพารามิเตอร์เริ่มต้น / สิ้นสุดของคุณ
- ตัวบ่งชี้คำนวณปริมาณติ๊กในแต่ละขั้นตอนราคาและแสดงแท่งแนวนอนที่แสดงกิจกรรมสัมพัทธ์
- แท่งที่ยาวที่สุดแสดงถึง POC และพื้นที่ที่มีเงาสีอ่อนแสดงถึง พื้นที่มูลค่า (ค่าเริ่มต้น 70%)
เหมาะสำหรับ
- นักเทรดรายวันและสวิงที่วิเคราะห์ความเข้มข้นของสภาพคล่อง
- นักพัฒนากลยุทธ์ที่ใช้ปริมาณเป็นฐานที่มองหาโซนที่ขับเคลื่อนด้วยข้อมูล
- นักเทรดที่ใช้จุด POC หรือระดับกลับตัว/ความสอดคล้องของพื้นที่มูลค่า
สรุป
สรุปโดย AI
Volume Profile Pro is a fixed-range volume analysis indicator designed to visualize trading volume distribution by price within a user-defined chart range. It calculates tick volume at each price level and displays a horizontal histogram that highlights key market structure elements such as the Point of Control (POC)—the price with the highest traded volume—and the 70% Value Area, representing the price range where most trading activity occurred. Users can select the analysis range by date or bar index and adjust the resolution through customizable bin counts or fixed pip steps. The indicator offers flexible visualization options, including side placement, width scaling, and opacity adjustments, to enhance chart readability. Its efficient computation supports real-time volume studies without impacting terminal performance. Volume Profile Pro is suitable for intraday and swing traders, volume-based strategy developers, and those utilizing POC or Value Area levels for trading decisions. It supports multiple markets and symbols, including Forex pairs (EURUSD, GBPUSD, NZDUSD, USDJPY), cryptocurrencies (BTCUSD), commodities (XAUUSD), indices (NAS100), and stocks.
โปรไฟล์อินดิเคเตอร์
รีวิวจากลูกค้า
5.0
รีวิว: 3
5 | 100 % | |
4 | 0 % | |
3 | 0 % | |
2 | 0 % | |
1 | 0 % |
รีวิวจากลูกค้า
October 20, 2025
Practical market note if the trader wants it adds useful information behind the price move. It works best as support, not a final decision maker. Volume context is stronger when POC, VWAP and value area agree across 2 sessions. volume alone can be noisy without price action.
October 19, 2025
October 19, 2025
Focused demo option for traders who want confirmation beyond candles. It gives value around volume based context, but volume alone can be noisy without price action. I would review 20 reactions near POC or VWAP before trusting the read. The data helps most when price action confirms the same zone.
การสนทนา
คำถามที่พบบ่อย
BTCUSD
Prop
Forex
Indices
Commodities
Crypto
Stocks
ผลิตภัณฑ์ที่มีให้บริการผ่าน cTrader Store รวมถึงบอทการเทรด อินดิเคเตอร์ และปลั๊กอิน มีให้บริการโดยนักพัฒนาบุคคลที่สามและมีไว้เพื่อวัตถุประสงค์ในการเข้าถึงข้อมูลและทางเทคนิคเท่านั้น cTrader Store ไม่ใช่โบรกเกอร์และไม่ได้ให้คำแนะนำการลงทุน คำแนะนำส่วนบุคคล หรือการรับประกันผลการดำเนินงานในอนาคต


ราคา
ตั้งแต่ 31/10/2024
56
การขาย
1.75K
ติดตั้งฟรี