
คำอธิบาย
📊 แดชบอร์ดช่วงพิปประจำวัน (เครื่องมือ ADR ที่สอดคล้องกับเซสชัน)
The แดชบอร์ดช่วงพิปประจำวัน เป็นยูทิลิตี้การเทรดมืออาชีพที่แสดงสถิติช่วงประจำวันแบบเรียลไทม์โดยตรงบนชาร์ตของคุณ — สอดคล้องอย่างเต็มที่กับเซสชัน UTC ของโบรกเกอร์ของคุณ
ออกแบบมาสำหรับเทรดเดอร์ที่ต้องการความแม่นยำ เครื่องมือนี้คำนวณช่วงพิปสูง-ต่ำโดยใช้ขอบเขตประจำวันตามเซสชันจริง และให้สถิติแบบหมุนเวียนที่ทรงพลังสำหรับบริบทตลาดและการวิเคราะห์ความผันผวน
🔥 คุณสมบัติหลัก
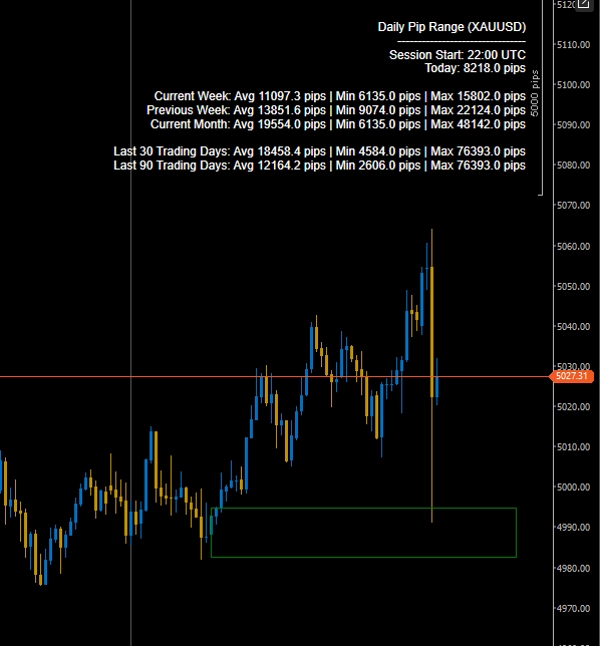
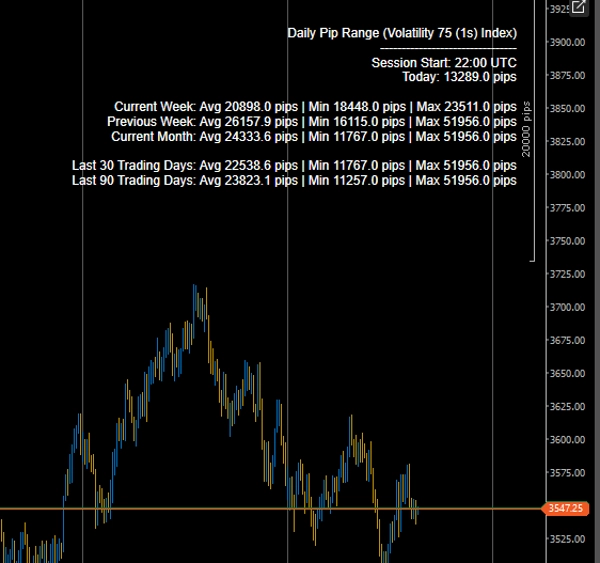
✅ ช่วงประจำวันสดของวันนี้ (สูง–ต่ำเป็นพิป)
ดูช่วงพิปของเซสชันปัจจุบันที่อัปเดตแบบเรียลไทม์
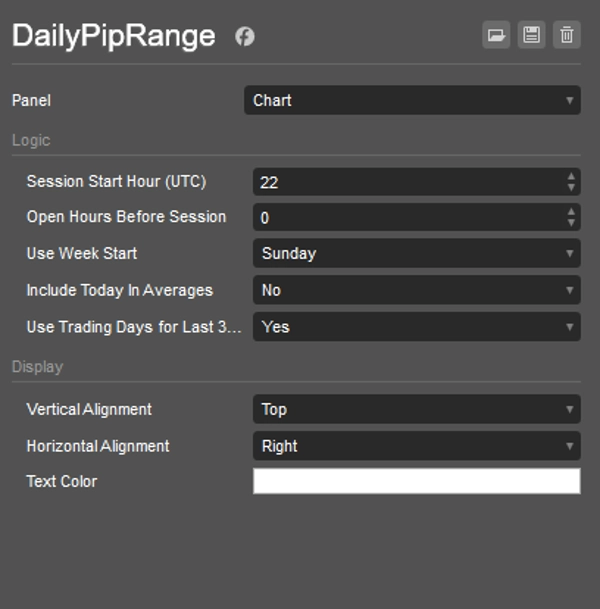
✅ การคำนวณที่สอดคล้องกับเซสชัน (ควบคุมโดย UTC)
กำหนด:
- ชั่วโมงเริ่มต้นเซสชัน (UTC)
- ชั่วโมงเปิดก่อนเซสชัน
สิ่งนี้ช่วยให้สถิติประจำวันของคุณตรงกับวันเทรดของโบรกเกอร์ — เหมาะสำหรับการสอดคล้องกับการปิด NY และการวิเคราะห์สไตล์สถาบัน
✅ การแยกวิเคราะห์สถิติขั้นสูง
สำหรับแต่ละช่วงเวลา ตัวบ่งชี้จะแสดง:
- ช่วงประจำวันเฉลี่ย
- ช่วงประจำวันขั้นต่ำ
- ช่วงประจำวันสูงสุด
ช่วงเวลาที่รวมอยู่:
- สัปดาห์ปัจจุบัน
- สัปดาห์ก่อนหน้า
- เดือนปัจจุบัน
- 30 วันที่ผ่านมา
- 90 วันที่ผ่านมา
✅ สลับระหว่างวันเทรดหรือวันปฏิทิน
เลือกได้ระหว่าง:
- 30/90 วันที่ผ่านมาในปฏิทิน
- 30/90 วันที่เทรดที่ผ่านมา (เฉพาะแท่งรายวัน)
เหมาะสำหรับการกรองวันหยุดสุดสัปดาห์และช่องว่างที่ไม่ใช่วันเทรด
✅ การแสดงผลที่ปรับแต่งได้
- ตำแหน่งหน้าจอที่ปรับได้ (มุมบนขวา ฯลฯ)
- ปรับแต่งสีข้อความ
- โอเวอร์เลย์น้ำหนักเบาและไม่รบกวน
🎯 ทำไมต้องใช้เครื่องมือนี้?
- ระบุการขยายและหดตัวของความผันผวน
- เปรียบเทียบช่วงวันนี้กับค่าเฉลี่ยในอดีต
- สังเกตการบีบตัวก่อนการเบรคเอาท์
- กรองการเทรดตามบริบท ADR
- ปรับปรุงขนาดความเสี่ยงตามสภาพความผันผวน
ไม่ว่าคุณจะเทรดแบบอินทราเดย์ สวิง หรือทอง เครื่องมือนี้จะให้ข้อมูลความผันผวนทันทีโดยไม่รก
⚙️ เหมาะสำหรับ
- เทรดเดอร์ฟอเร็กซ์
- เทรดเดอร์ทองคำ (XAUUSD)
- เทรดเดอร์ดัชนี
- ระบบที่อิงความผันผวน
- เทรดเดอร์เบรคเอาท์
- การวิเคราะห์ช่วงสไตล์สถาบัน
🚀 ความตระหนักรู้ความผันผวนระดับมืออาชีพ - โดยตรงบนชาร์ตของคุณ
สร้างขึ้นเพื่อประสิทธิภาพ ความแม่นยำ และความแม่นยำของเซสชัน
สรุป
รีวิวจากลูกค้า
5 | 50 % | |
4 | 50 % | |
3 | 0 % | |
2 | 0 % | |
1 | 0 % |


