
AutoFib Navigator
อินดิเคเตอร์
เวอร์ชัน 1.0, Oct 2025
Windows, Mac
4.5
รีวิว: 2
คำอธิบาย
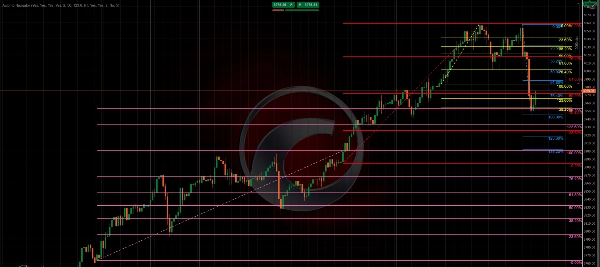
AutoFib Navigator วาดเส้น Fibonacci retracements อัตโนมัติสำหรับ รายวัน, เมื่อวานนี้, สัปดาห์ปัจจุบัน, และ สัปดาห์ก่อนหน้า ช่วงเวลา
มันให้มุมมองที่ชัดเจนและสม่ำเสมอของการถอยกลับตลาด การขยาย และพฤติกรรมสวิงตามช่วงเวลาโดยไม่ต้องวาดด้วยมือ
เครื่องมือนี้ปรับตัวอย่างชาญฉลาดกับการเคลื่อนไหวของราคา — อัปเดตเฉพาะเมื่อราคาขยับเกิน Target Trigger ที่ตั้งค่าได้ (เช่น 123.6%) — เพื่อให้แผนภูมิของคุณแม่นยำและไม่รกตลอดวันหรือสัปดาห์การซื้อขาย
คุณสมบัติหลัก
- โซน Fibonacci อัตโนมัติ: วาดเส้นถอยกลับรายวัน, เมื่อวานนี้, รายสัปดาห์ และสัปดาห์ก่อนหน้าแบบเรียลไทม์
- ตรรกะการวาดซ้ำอัจฉริยะ: คำนวณใหม่เฉพาะหลังจากราคาทะลุการขยายเป้าหมายที่กำหนดไว้ เพื่อหลีกเลี่ยงการยึดจุดใหม่โดยไม่จำเป็น
- การรับรู้ทิศทาง: พลิกทิศทาง Fibonacci โดยอัตโนมัติตามราคาที่สัมพันธ์กับระดับถอยกลับ 50%
- พารามิเตอร์ที่ปรับแต่งได้: สี, การมองเห็น, ช่วงเวลา, ความหนาของเส้น และพฤติกรรมการวาดซ้ำสามารถปรับได้ทั้งหมด
- ประสิทธิภาพที่เหมาะสม: กระบวนการเบื้องหลังที่เบาโดยใช้ระบบอัปเดตตามเวลาสำหรับประสิทธิภาพ
- การนำเสนออย่างมืออาชีพ: ภาพแผนภูมิที่สะอาดและสม่ำเสมอ เหมาะสำหรับสไตล์การซื้อขายทุกประเภท
การใช้งานที่แนะนำ
ใช้ AutoFib Navigator เพื่อระบุระดับการถอยกลับและการขยายตัวแบบไดนามิกในช่วงเวลารายวันและรายสัปดาห์
เหมาะสำหรับเทรดเดอร์ที่พึ่งพาการรวมตัวของ Fibonacci, การวิเคราะห์โครงสร้าง หรือการตั้งค่าหลายช่วงเวลา
สรุป
โปรไฟล์อินดิเคเตอร์
รีวิวจากลูกค้า
4.5
รีวิว: 2
5 | 50 % | |
4 | 50 % | |
3 | 0 % | |
2 | 0 % | |
1 | 0 % |
การสนทนา
คำถามที่พบบ่อย
BTCUSD
Forex
Indices
EURUSD
Commodities
GBPUSD
NZDUSD
Prop
Crypto
Stocks
XAUUSD
NAS100
USDJPY
ผลิตภัณฑ์ที่มีให้บริการผ่าน cTrader Store รวมถึงบอทการเทรด อินดิเคเตอร์ และปลั๊กอิน มีให้บริการโดยนักพัฒนาบุคคลที่สามและมีไว้เพื่อวัตถุประสงค์ในการเข้าถึงข้อมูลและทางเทคนิคเท่านั้น cTrader Store ไม่ใช่โบรกเกอร์และไม่ได้ให้คำแนะนำการลงทุน คำแนะนำส่วนบุคคล หรือการรับประกันผลการดำเนินงานในอนาคต


!["[CB] Pivot Points Pro" โลโก้](https://cdn.ctrader.com/image/webp/43463c82-67b0-4f10-a4ba-901bba091d81_32594)


ราคา
ตั้งแต่ 31/10/2024
56
การขาย
1.74K
ติดตั้งฟรี