
คำอธิบาย
ตัวบ่งชี้การล่าปลาวาฬ – Bukhari Academy
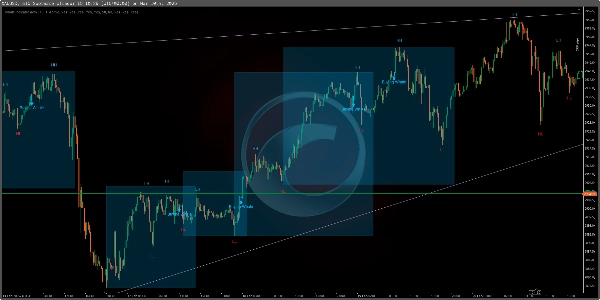
ตัวตัวบ่งชี้การล่าปลาวาฬ เป็นเครื่องมือการซื้อขายที่ทรงพลัง ที่ออกแบบมาเฉพาะสำหรับ ดัชนี Boom & Crash และดัชนีความผันผวน มีฟีเจอร์ Auto Trend Detector ตรวจจับ แนวโน้มขาขึ้นและขาลง ทำเครื่องหมาย จุดโครงสร้างตลาด (HH, HL, LH, LL) และให้ สัญญาณซื้อและขายที่มีความแม่นยำสูง เพื่อช่วยให้นักเทรดตัดสินใจอย่างมีข้อมูล
คุณสมบัติหลัก:
✅ Auto Trend Detector – ระบุแนวโน้มตลาดโดยอัตโนมัติ ลดความจำเป็นในการวิเคราะห์ด้วยตนเอง
✅ ออกแบบมาสำหรับดัชนี Boom & Crash และดัชนีความผันผวน – ปรับแต่งเพื่อการซื้อขายในตลาดสังเคราะห์เหล่านี้
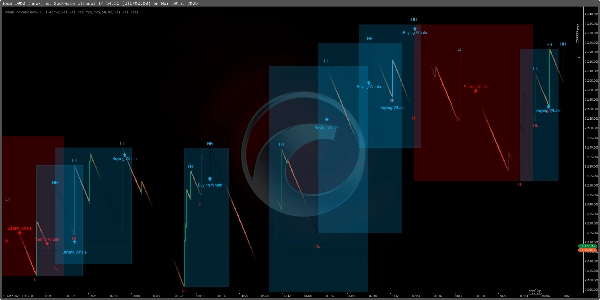
✅ การตรวจจับสไปค์บน Boom & Crash (กรอบเวลา M1) – ระบุ สไปค์บน M1 ช่วยให้นักเทรดจับการเคลื่อนไหวราคาที่รวดเร็วได้
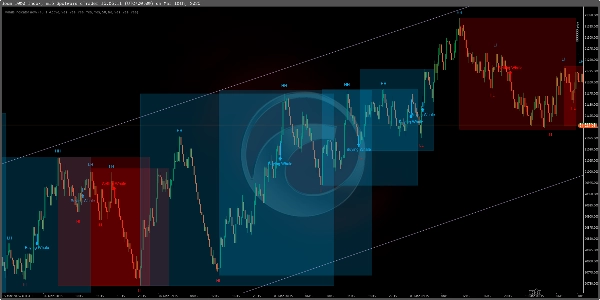
✅ การระบุแนวโน้มบน M15 – ทำงานได้อย่างมีประสิทธิภาพบน M15 สำหรับการวิเคราะห์แนวโน้มปกติ และการตั้งค่าการซื้อขายที่มีโครงสร้าง
✅ การวิเคราะห์โครงสร้างตลาด – แสดง Higher Highs (HH), Higher Lows (HL), Lower Highs (LH), และ Lower Lows (LL) เพื่อความเข้าใจแนวโน้มที่ดีขึ้น
✅ สัญญาณเข้าตลาดปลาวาฬ – เน้นจุด "ปลาวาฬซื้อ" และ "ปลาวาฬขาย" สำหรับการเข้าซื้อขายที่แม่นยำ
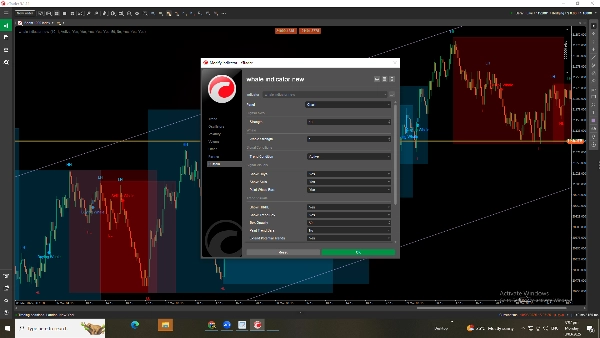
✅ การตั้งค่าที่ปรับแต่งได้อย่างเต็มที่ – ปรับ ความแข็งแกร่งของปลาวาฬ, ความไวของสัญญาณ และเงื่อนไขแนวโน้ม เพื่อปรับปรุงวิธีการซื้อขายของคุณ
✅ เปิด/ปิดฟีเจอร์ – สลับ กล่องแนวโน้ม, จุดโครงสร้าง และสัญญาณซื้อ/ขาย ตามความต้องการ
วิธีใช้ตัวบ่งชี้การล่าปลาวาฬ?
1️⃣ การตรวจจับแนวโน้มอัตโนมัติ – ให้ตัวบ่งชี้ระบุทิศทางแนวโน้มโดยอัตโนมัติ
2️⃣ ซื้อขายสไปค์ Boom & Crash บน M1 – มองหาสัญญาณบน M1 เพื่อจับสไปค์ราคา อย่างมีประสิทธิภาพ
3️⃣ วิเคราะห์แนวโน้มตลาดบน M15 – ใช้ M15 สำหรับการวิเคราะห์แนวโน้มที่มีโครงสร้าง และยืนยันการซื้อขาย
4️⃣ ติดตามโครงสร้างตลาด – ใช้ HH, HL, LH, LL เพื่อเข้าใจทิศทางและความแข็งแกร่งของแนวโน้ม
5️⃣ มองหาสัญญาณปลาวาฬ – เข้าซื้อขายที่จุด "ปลาวาฬซื้อ" หรือ "ปลาวาฬขาย"
6️⃣ ปรับแต่งเพื่อความแม่นยำ – ปรับ ความแข็งแกร่งของปลาวาฬและความไวของสัญญาณ เพื่อเพิ่มประสิทธิภาพผลลัพธ์
7️⃣ เปิด/ปิดฟีเจอร์ – ปรับเงื่อนไขแนวโน้มและการตั้งค่าโครงสร้างตามกลยุทธ์ของคุณ
ตัวบ่งชี้นี้เหมาะสำหรับ ดัชนี Boom & Crash และดัชนีความผันผวน โดยให้ โอกาสการซื้อขายที่มีความน่าจะเป็นสูงด้วยความแม่นยำและประสิทธิภาพ 🚀
สรุป
Key functionalities include spike detection on the M1 timeframe for Boom & Crash indices to capture rapid price movements, and trend identification on the M15 timeframe for structured trade setups. Users can customize settings such as whale strength, signal sensitivity, and trend conditions to refine their trading approach. Features like trend boxes, structure points, and buy/sell signals can be enabled or disabled according to user preference.
The indicator supports efficient analysis and trade execution in synthetic markets, offering tools for both short-term spike trading and longer-term trend analysis. It is suitable for traders focusing on Boom & Crash and Volatility indices who seek precise market insights and customizable signal options.
รีวิวจากลูกค้า
5 | 33 % | |
4 | 67 % | |
3 | 0 % | |
2 | 0 % | |
1 | 0 % |


!["Smart Money Concepts (SMC) [Iridio Capital]" โลโก้](https://cdn.ctrader.com/image/webp/28b69fd1-ef54-4bed-9487-07e78e883be4_40934)


