
Descrizione
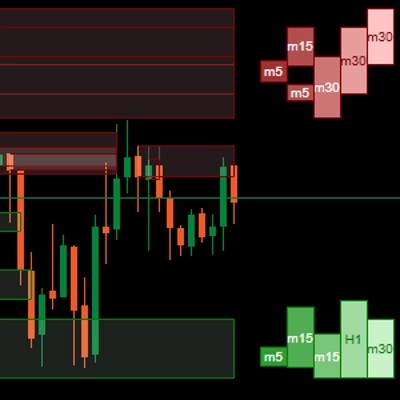
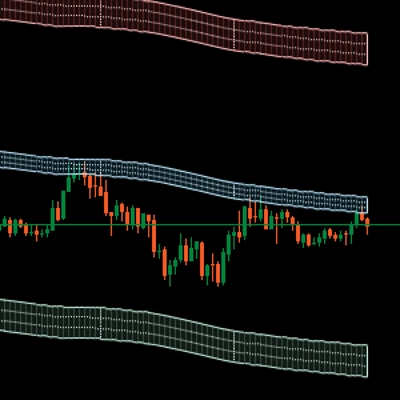
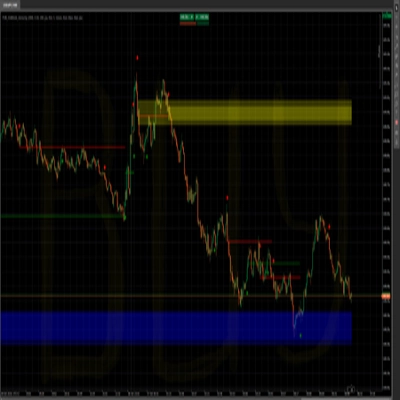
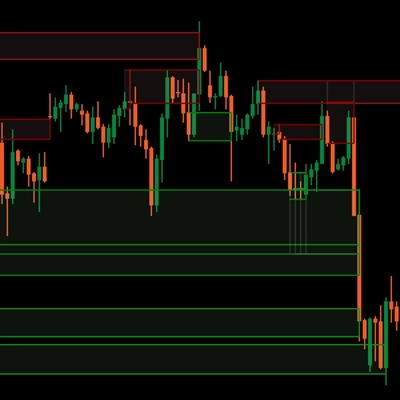
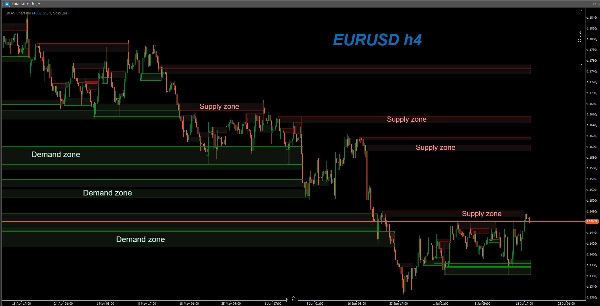
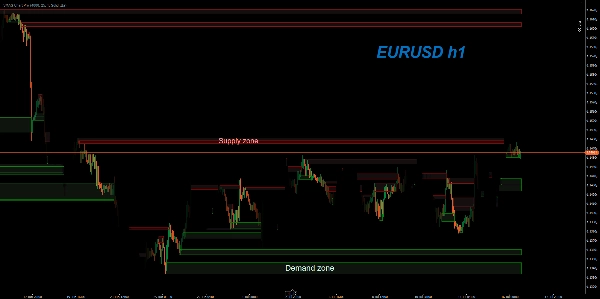
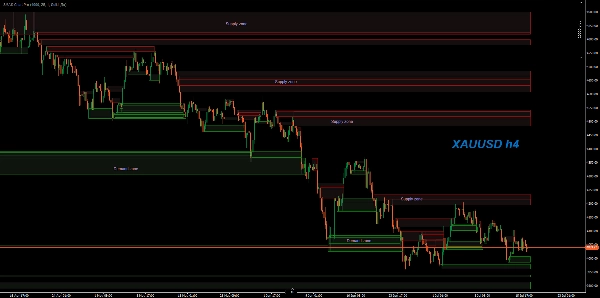
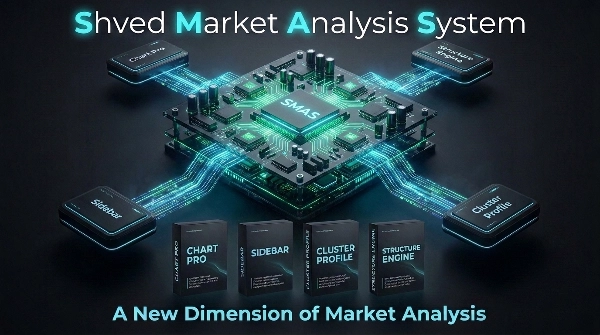
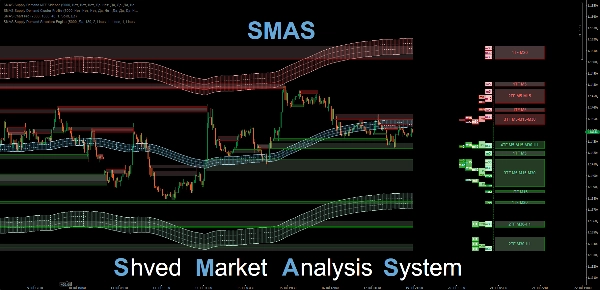
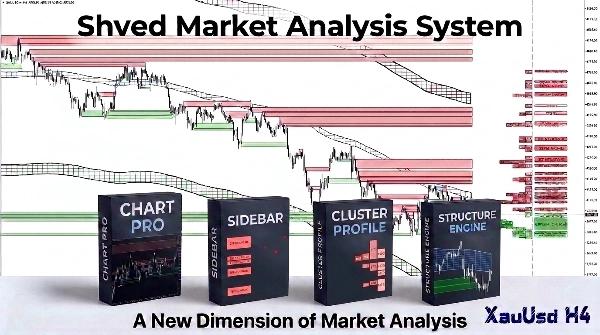
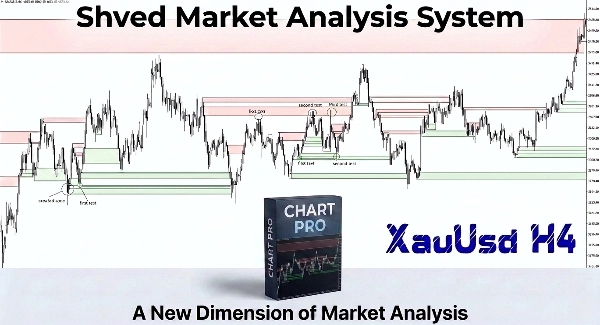
L'indicatore SMAS Chart Pro è un componente essenziale del Shved Market Analysis System (SMAS). È uno strumento analitico professionale per la piattaforma cTrader, progettato per il rilevamento automatico e il monitoraggio dinamico di forti zone di Offerta & Domanda direttamente sul tuo grafico dei prezzi.
Questo indicatore si basa sull'algoritmo proprietario Shved Supply and Demand, fidato da migliaia di trader in tutto il mondo. La versione Pro per cTrader presenta un algoritmo di rilevamento delle zone completamente ridisegnato e high-tech scritto in C# con una profonda ottimizzazione delle prestazioni per l'architettura cTrader Automate.
L'indicatore è altamente versatile: grazie all'ottimizzazione avanzata del codice, è perfettamente adatto sia per lo scalping intraday (timeframe M1 e M5) sia per il trading posizionale a lungo termine o l'investimento (H4, Daily e intervalli superiori).
Vantaggi chiave della versione cTrader:
- Algoritmo Proprietario Protetto: Tutte le proporzioni di rilevamento base funzionano automaticamente su qualsiasi asset. I parametri sono nascosti all'interno del codice per proteggere la proprietà intellettuale.
- Regolazione dell'Opacità della Zona: Un parametro personalizzato ti consente di regolare la trasparenza del riempimento della zona (i valori consigliati sono tra 25 e 40). Questo mantiene le tue candele e le linee della griglia perfettamente chiare sia su temi chiari che scuri del grafico.
- Monitoraggio Dinamico della Mitigazione: Una zona rimane attiva e si estende verso destra finché il prezzo non rompe il suo confine estremo (la regola "Break Both Levels"). Una volta che il prezzo assorbe completamente la barriera limite, il livello viene disattivato.
- Visualizzazione Storica di Test e Reazioni: Puoi abilitare la visualizzazione delle zone rotte (Show Invalid Zones). Rimangono sul grafico come linee sottili, cambiando colore per corrispondere alla base, permettendoti di analizzare visivamente i rimbalzi storici.
- Alte Prestazioni: Il codice è scritto in C# pulito (.NET) con debouncing basato su timer, garantendo un caricamento istantaneo del grafico e zero ritardi anche sul timeframe M1.
Raccomandazioni di Trading:
Le zone di Offerta e Domanda sono aree ideali per trovare punti di ingresso sui retest dei livelli con rischio minimo. Lo Stop Loss viene tipicamente posizionato appena oltre il confine esterno opposto della base, garantendo uno stop stretto e un alto rapporto Rischio/Rendimento per i tuoi trade.
==================================================
TRADUZIONE RUSSA / RUSSIAN VERSION
==================================================
Индикатор SMAS Chart Pro является важной частью торговой системы Shved Market Analysis System (SMAS). Это профессиональный аналитический инструмент для платформы cTrader, предназначенный для автоматического поиска и динамического ведения сильных зон спроса и предложения (Supply & Demand) непосредственно на вашем ценовом графике.
Этот индикатор создан на базе оригинального алгоритма Shved Supply and Demand, который завоевал доверие тысяч трейдеров. Версия Pro для cTrader получила полностью переработанный, высокотехнологичный алгоритм поиска зон, написанный на C# с глубокой оптимизацией производительности под архитектуру cTrader Automate.
Индикатор универсален: благодаря оптимизации кода он подходит как для внутридневного скальпинга (на таймфреймах M1 и M5), так и для долгосрочного позиционного трейдинга и инвестирования (на H4, Daily и старших интервалах).
Оригинальный алгоритм фильтрации шума:
Главное отличие индикатора от большинства стандартных программ заключается в его математическом ядре сканирования. Стандартные индикаторы часто отмечают любые случайные развороты цены или фракталы. SMAS Chart Pro использует фильтр рыночного шума: он оценивает скорость и импульс резкого выхода цены относительно размера и волатильности самого диапазона накопления ордеров.
Алгоритм математически вычисляет, был ли ценовой разворот результатом институциональной проторговки с нереализованным лимитным объемом или это обычный хаотичный шум. Это позволяет отсеивать слабые уровни, оставляя на графике только те зоны, от которых цена с высокой вероятностью получит сильную реакцию.
Модели поиска Price Action:
Алгоритм сканирует график на предмет формирования четырех классических моделей Price Action:
- Rally-Base-Rally (RBR) и Drop-Base-Rally (DBR) — для зон спроса (покупок / Demand).
- Drop-Base-Drop (DBD) и Rally-Base-Drop (RBD) — для зон предложения (продаж / Supply).
Каждый паттерн строго оценивается по пропорциям силы первоначального импульса, размера и длительности ценовой консолидации, а также скорости последующего выхода цены из этого диапазона.
Ключевые преимущества версии для cTrader:
- Защищенный авторский алгоритм: Все пропорции поиска баз настроены профессионально и работают автоматически на любых инструментах. Параметры скрыты внутри кода для защиты интеллектуальной собственности.
- Регулировка прозрачности (Zone Opacity): Специальный параметр позволяет настроить прозрачность заливки зон (рекомендуемое значение — от 25 до 40). Это позволяет сохранить полную четкость свечей и сетки графика на любой теме терминала (светлой или темной).
- Динамическое ведение зон (Mitigation): Зона остается полностью активной и продлевается вправо, пока цена не пробьет её экстремум (правило Break Both Levels). Как только цена полностью поглощает лимитный барьер, уровень деактивируется.
- История тестов и реакций: Вы можете включить отображение пробитых зон (Show Invalid Zones). Они останутся на графике в виде тонких линий, изменив цвет на цвет базы, что позволит наглядно оценивать историю отскоков.
- Высокая производительность: Код написан на чистом C# (.NET) и оптимизирован для стабильной работы даже при анализе глубокой истории баров.
Riepilogo
Key features include automatic zone detection with protected algorithm parameters, adjustable zone opacity for clear visualization on different chart themes, and dynamic mitigation tracking where zones remain active until price breaks their boundaries. It also offers a historical view of broken zones to analyze past price reactions. The algorithm filters market noise by evaluating price impulse strength, consolidation size, and volatility to highlight only significant zones likely to influence price action.
The indicator scans for four classic Price Action patterns—Rally-Base-Rally, Drop-Base-Rally, Drop-Base-Drop, and Rally-Base-Drop—to identify demand and supply zones. These zones serve as potential entry points with defined stop loss placement beyond opposite boundaries, aiming for favorable risk/reward ratios. SMAS Supply Demand Chart Pro is designed for use on any asset and integrates smoothly within the cTrader Automate environment.