
Deskripsi
Indikator Price Jump Exit and Re-entry (PjER) adalah indikator manajemen risiko yang didasarkan pada makalah akademik “A dynamic price jump exit and reentry strategy for intraday trading” oleh Koegelenberg & van Vuuren (2024), Diterbitkan di Jurnal Expert Systems With Applications.
Inovasi Utama
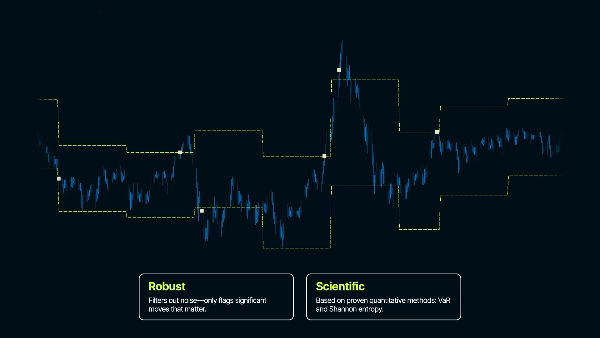
- Estimasi VaR dari potensi kerugian sebelum terjadi
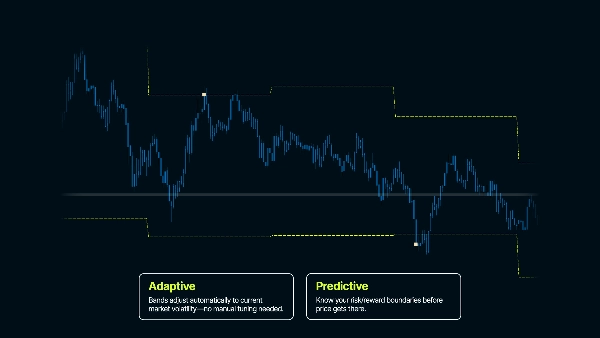
- Ketahanan terhadap tren pasar yang kuat dalam jangka waktu pendek
- Analisis koreksi pasar pasca loncatan harga untuk waktu masuk kembali yang aman
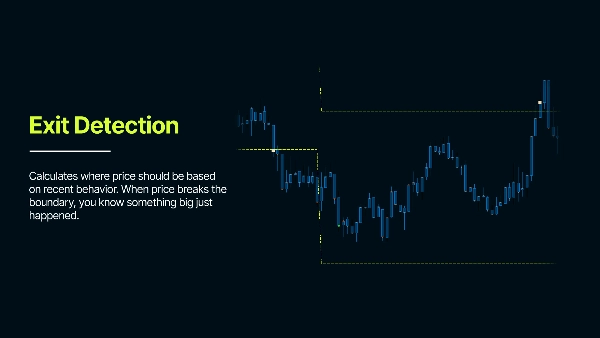
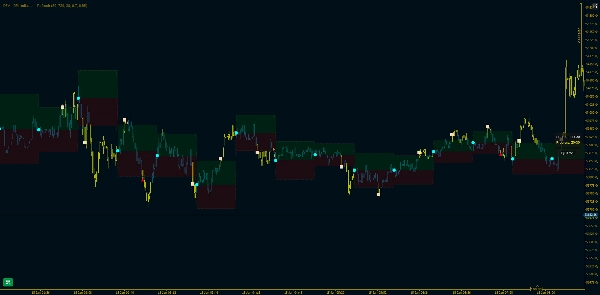
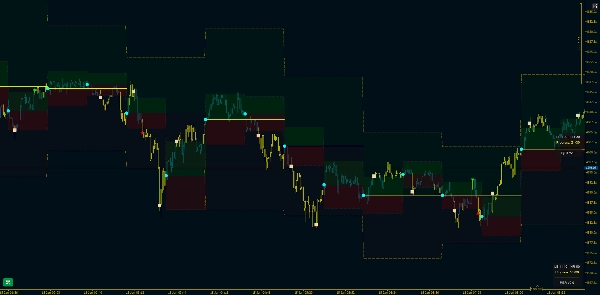
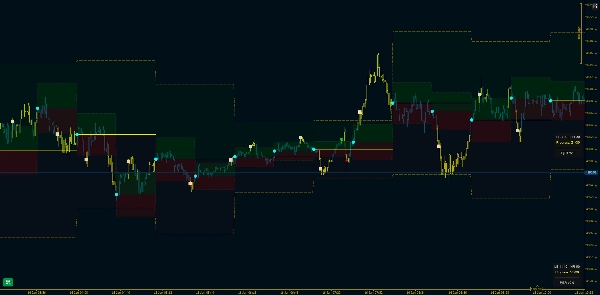
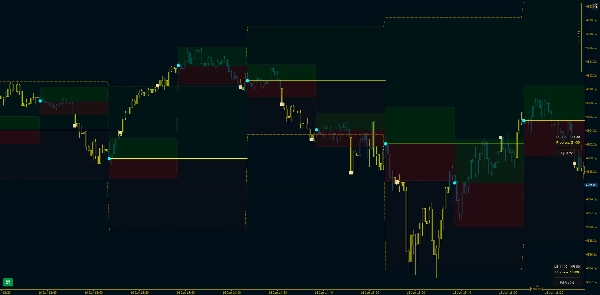
Ini menganalisis pergerakan harga masa lalu untuk memahami volatilitas tipikal dan Membuat Interval Kepercayaan - yang mewakili rentang harga yang diharapkan. Ketika harga melompat keluar dari pita ini, itu menandakan bahwa sesuatu yang tidak normal terjadi.
Kasus Penggunaan Target
Perdagangan intraday (terutama strategi berbasis rentang). Indikator ini membuat batas statistik di sekitar harga untuk mendeteksi pergerakan harga yang tidak normal. Dalam perilaku pasar normal, harga tetap dalam rentang yang diharapkan berdasarkan volatilitas terbaru. Ketika harga menembus pita ini, itu menandakan bahwa sesuatu yang tidak biasa sedang terjadi - titik keluar potensial dari perdagangan atau terobosan dalam struktur pasar, karena perilaku pasar telah berubah.
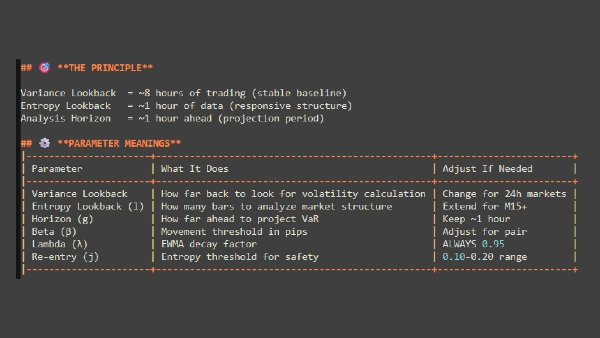
Parameter Inti Dijelaskan
Max Days Back - Menentukan seberapa jauh ke belakang dalam sejarah indikator mulai bekerja
GMT Offset - Menyesuaikan zona waktu Anda. Memastikan perhitungan tanggal sesuai dengan waktu lokal Anda
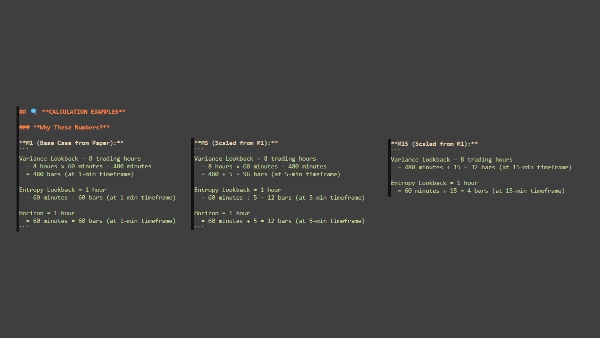
Periode Lookback (batang)
"Berapa banyak riwayat harga yang harus saya gunakan untuk mengukur perilaku 'normal'?"
- Berapa banyak batang data historis yang digunakan untuk menghitung volatilitas
- Lebih banyak batang = lebih stabil tapi lambat beradaptasi; lebih sedikit batang = reaksi lebih cepat tapi lebih berisik
- Contoh: 1440 batang pada M1 = 24 jam data
Horizon Analisis (batang)
"Berapa lama saya harus mengamati harga sebelum memulai ulang?"
- Berapa lama setiap periode analisis berlangsung sebelum pita direset
- Menetapkan kerangka waktu yang Anda analisis - lebih pendek = reset lebih sering, lebih lama = pita tetap tetap lebih lama
- Contoh: 60 batang = pita tetap selama 60 batang, kemudian dihitung ulang dari harga referensi baru
Probabilitas Risiko
"Seberapa yakin saya ingin bahwa harga biasanya tidak akan mencapai level ini?"
- Menetapkan tingkat kepercayaan untuk pita (seperti margin keamanan)
- Nilai lebih tinggi = pita lebih lebar (sinyal lebih sedikit), nilai lebih rendah = pita lebih ketat (sinyal lebih banyak)
- Contoh: 0.80 = 80% kepercayaan bahwa harga tetap dalam pita dalam kondisi normal
Faktor Peluruhan (λ - Lambda)
"Haruskah saya lebih memperhatikan apa yang baru saja terjadi atau memperlakukan semua sejarah secara sama?"
- Mengontrol seberapa banyak bobot yang diberikan pada data terbaru vs data lama dalam perhitungan volatilitas
- Nilai lebih tinggi = data terbaru lebih penting; nilai lebih rendah = semua data diberi bobot lebih merata
- Contoh 0.95 = volatilitas terbaru sangat memengaruhi perhitungan
POIN PENTING UNTUK DIINGAT
Ini adalah alat MANAJEMEN RISIKO – Mengidentifikasi kejadian volatilitas dan stabilitas selama periode waktu
Interval Kepercayaan sangat penting – Pita TIDAK boleh mengikuti harga seperti ATR – Pita dihitung untuk setiap periode analisis
Masuk kembali memerlukan kesabaran – Jangan berharap masuk kembali langsung setelah keluar – Pasar membutuhkan waktu untuk stabil
Parameter spesifik aset dan kerangka waktu – Parameter default adalah titik awal – Optimalkan untuk pasar dan gaya Anda – Apa yang bekerja di FX mungkin tidak bekerja untuk Indeks, Logam atau Kripto.
( * ) Indikator ini disediakan hanya untuk tujuan edukasi dan informasi. Ini tidak dimaksudkan sebagai nasihat keuangan atau investasi. Tidak ada dalam produk ini, dokumentasinya, atau materi terkait yang boleh dianggap sebagai rekomendasi untuk membeli, menjual, atau menahan instrumen keuangan apa pun. Perdagangan di pasar keuangan melibatkan risiko signifikan dan mungkin tidak cocok untuk semua investor. Kinerja masa lalu tidak menunjukkan hasil di masa depan. Tidak ada jaminan keuntungan, dan pengguna dapat mengalami kerugian besar. Dengan menggunakan indikator ini, Anda mengakui bahwa Anda bertanggung jawab penuh atas keputusan perdagangan dan hasil keuangan Anda sendiri. Pembuat produk ini tidak bertanggung jawab atas kerugian atau kerusakan yang timbul secara langsung atau tidak langsung dari penggunaannya. Selalu lakukan analisis Anda sendiri sebelum membuat keputusan perdagangan apa pun.
Ringkasan
Key features include Value at Risk (VaR) estimates to anticipate potential losses, robustness against strong short-term trends, and analysis of post-jump corrections to identify safe re-entry timings. Core adjustable parameters allow users to tailor the indicator to specific assets and timeframes, including lookback period for volatility calculation, analysis horizon for band recalculation frequency, risk probability to set confidence levels, and decay factor to weight recent versus older data.
The indicator emphasizes patience for re-entry after exits, as market stabilization is required. It is intended as a tool for identifying volatility events and managing risk rather than providing direct trade signals. Users should optimize parameters according to their trading style and market conditions.
Ulasan pelanggan
5 | 100 % | |
4 | 0 % | |
3 | 0 % | |
2 | 0 % | |
1 | 0 % |


