
Footprint Chart_noSourceCode
Indikator
1 pembelian
Versi 1.0, Sep 2025
Windows, Mac
4.3
Ulasan: 3
Deskripsi
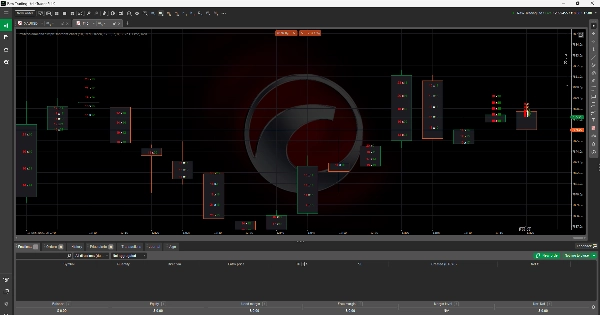
Indikator Grafik Jejak
Indikator Grafik Jejak memberikan pedagang pandangan rinci tentang aliran pesanan dengan menampilkan volume bid dan ask langsung di dalam setiap lilin harga. Berbeda dengan grafik lilin tradisional, alat ini memungkinkan pengguna melihat di mana tekanan beli dan jual terkonsentrasi pada tingkat harga tertentu. Dengan menyoroti ketidakseimbangan antara pembeli dan penjual, alat ini menawarkan wawasan lebih dalam tentang kedalaman pasar, likuiditas, dan aktivitas perdagangan. Ini menjadikannya alat penting bagi pedagang yang ingin menyempurnakan entri, keluar, dan manajemen risiko melalui analisis aliran pesanan yang canggih.
Ringkasan
Ringkasan AI
The Footprint Chart Indicator enhances traditional candlestick charts by displaying bid and ask volumes within each price candle. This visualization allows traders to observe buying and selling pressure at specific price levels, revealing imbalances between buyers and sellers. By providing detailed insights into order flow, market depth, liquidity, and trading activity, the indicator supports more precise trade entries, exits, and risk management decisions. It is applicable across various markets including Forex, cryptocurrencies (e.g., BTCUSD), commodities, indices, and stocks. The tool is designed for traders who utilize advanced order flow analysis to refine their strategies.
Profil indikator
Ulasan pelanggan
4.3
Ulasan: 3
5 | 67 % | |
4 | 0 % | |
3 | 33 % | |
2 | 0 % | |
1 | 0 % |
Ulasan pelanggan
September 29, 2025
This fits volume based context better as a review layer. The first forward check can be 97 setups on M1, with 20 reactions and manual notes.
September 26, 2025
More useful for someone who wants less noise in the process. The best use is checking participation and pressure, then leaving the final filter manual.
September 23, 2025
I liked it more as a confirmation layer for volume based context than as something to follow blindly. Pressure is easier to read, and the final decision still feels like it belongs to the trader. Light sizing makes the early sample easier to judge.
Diskusi
Pertanyaan umum
BTCUSD
Forex
Signal
Indices
EURUSD
Commodities
GBPUSD
NZDUSD
Prop
Scalping
Crypto
Stocks
XAUUSD
NAS100
USDJPY
Produk-produk yang tersedia melalui cTrader Store, termasuk bot trading, indikator, dan plugin, disediakan oleh pengembang pihak ketiga serta hanya ditujukan untuk akses teknis dan informasi. cTrader Store bukan broker dan tidak menyediakan saran investasi, rekomendasi pribadi, atau jaminan apa pun tentang kinerja di masa mendatang.
Produk lain dari penulis ini


Harga
Sejak 15/01/2025
7
Penjualan