
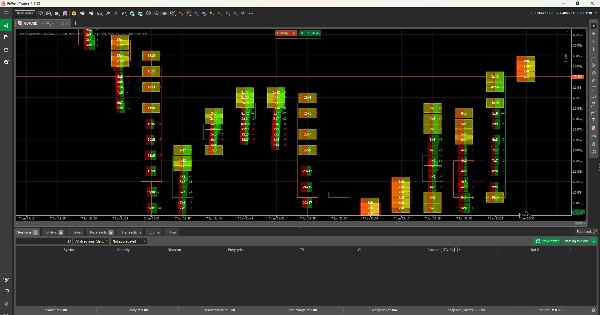
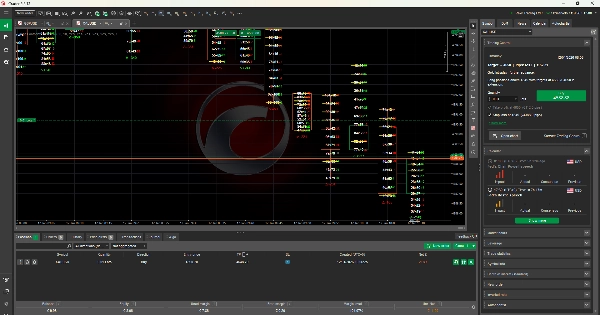
Delta Footprint Bid x Ask
Indikator
2 pembelian
Versi 2.0, Feb 2026
Windows, Mac
4.5
Ulasan: 2
Deskripsi
Apa yang Termasuk:
- Ikhtisar - Apa yang dilakukan indikator
- Konsep Footprint - Apa itu perdagangan footprint
- Metode Perhitungan Terperinci - Bagaimana volume dihitung:
-
- Pembuatan level harga
- Algoritma distribusi volume
- Logika pembagian beli/jual
- Contoh perhitungan
- Penjelasan Tampilan Volume - Apa arti "45x120"
- Interpretasi Delta - Positif, negatif, dan kumulatif
- Fitur Utama - Ketidakseimbangan, POC, batang volume
- Teori Aliran Pesanan - Penjelasan Bid vs Ask
- Batasan Penting - Penjelasan jujur bahwa ini perkiraan, bukan data tick nyata
- Aplikasi Perdagangan - 5 skenario perdagangan dunia nyata
- Panduan Pengaturan - Penjelasan lengkap semua parameter
- Rekomendasi Timeframe - Pengaturan terbaik untuk berbagai gaya
- Tips & Praktik Terbaik
Poin Penting Tentang Perhitungan:
Dokumen ini dengan jelas menjelaskan bahwa:
Volume DIPERKIRAKAN - karena cTrader tidak menyediakan data tick nyata Algoritma cerdas - menggunakan beberapa faktor (jenis candle, posisi harga, kedekatan penutupan) Pola akurat - hubungan relatif mencerminkan aliran pesanan nyata Jujur tentang batasan - menjelaskan kapan Anda membutuhkan data pertukaran nyata Menampilkan rumus tepat - transparansi lengkap pada perhitungan
Ini memberikan pengguna ekspektasi realistis sambil menyoroti nilai indikator! 📊
Ringkasan
Ringkasan AI
Delta Footprint Bid x Ask is a footprint volume indicator designed to display bid and ask volume splits at each price level. It estimates volume distribution using an intelligent algorithm that incorporates factors such as candle type, price position, and close proximity, as real tick data is not available on the cTrader platform. The indicator provides detailed volume calculations, including price level creation, buy/sell split logic, and example computations, offering transparency through exact formulas. Key features include identification of volume imbalances, point of control (POC), and volume bars, supporting analysis of order flow by comparing bid versus ask volumes. The indicator explains delta values—positive, negative, and cumulative—and offers guidance on settings and timeframe recommendations for various trading styles. It is applicable across multiple markets and symbols, including Forex pairs (EURUSD, GBPUSD, USDJPY, NZDUSD), indices (NAS100, SP500, DAX), commodities (gold, oil, silver), cryptocurrencies (BTCUSD), and stocks. The tool includes practical trading applications and best practices, helping users interpret footprint patterns that realistically mirror order flow despite volume estimates.
Profil indikator
Ulasan pelanggan
4.5
Ulasan: 2
5 | 50 % | |
4 | 50 % | |
3 | 0 % | |
2 | 0 % | |
1 | 0 % |
Ulasan pelanggan
January 20, 2026
For volume based context, this feels more useful as a filter than a full system. The journal should cover 55 setups and the trade context.
January 12, 2026
For me the fair test is value area with POC and VWAP. If the result still looks clean, the product becomes easier to trust.
Diskusi
Pertanyaan umum
BTCUSD
Forex
Signal
Indices
EURUSD
Commodities
GBPUSD
NZDUSD
Prop
Scalping
Supertrend
Fair Value Gap
Crypto
Stocks
XAUUSD
NAS100
USDJPY
Produk-produk yang tersedia melalui cTrader Store, termasuk bot trading, indikator, dan plugin, disediakan oleh pengembang pihak ketiga serta hanya ditujukan untuk akses teknis dan informasi. cTrader Store bukan broker dan tidak menyediakan saran investasi, rekomendasi pribadi, atau jaminan apa pun tentang kinerja di masa mendatang.
Produk lain dari penulis ini


Harga
Sejak 15/01/2025
7
Penjualan