
Cross EMA Pro
Индикатор
2 покупки
Версия 1.0, Sep 2024
Windows, Mac
4.5
Отзывы: 2
Описание
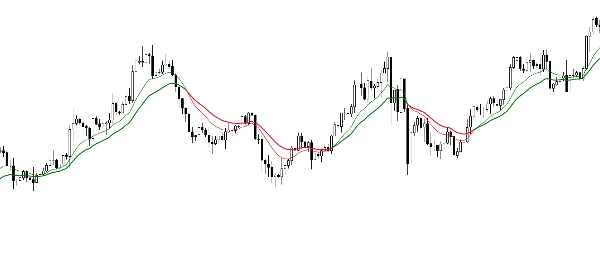
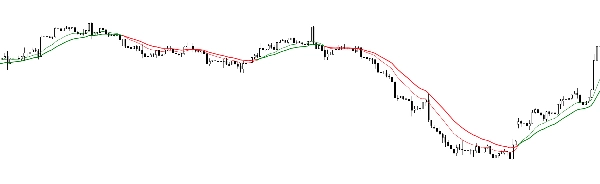
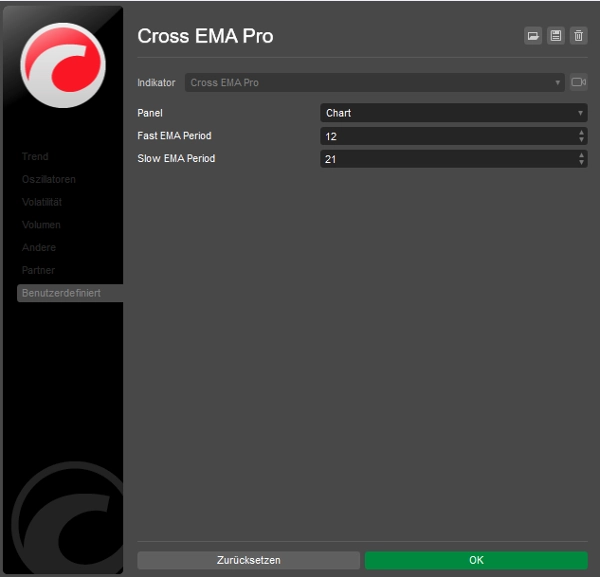
Cross EMA Pro помогает точно определить развороты тренда, визуализируя пересечение скользящих средних EMA с периодами 12 и 21. Цветовое кодирование облегчает быстрое определение направлений тренда.
- Сигналы пересечения: основаны на EMA с периодами 12 и 21
- Цветовое кодирование: зелёный для восходящих трендов, красный для нисходящих
- Гибкое использование: подходит для скальпинга, дневной торговли и долгосрочных стратегий
Сводка
ИИ-сводка
Cross EMA Pro is a trend reversal indicator that visualizes the crossover of 12-period and 21-period exponential moving averages (EMAs). It uses color coding—green for uptrends and red for downtrends—to help users quickly identify trend directions. The indicator provides clear crossover signals based on these two EMAs, making it suitable for various trading styles including scalping, day trading, and long-term strategies. It supports multiple markets such as Forex, stocks, indices, commodities, and cryptocurrencies including BTCUSD and XAUUSD. The indicator outputs visual signals on price charts to assist traders in recognizing potential trend reversals.
Профиль индикатора
Категория индикатора
Тренд
Тип вывода
Визуализация
Требования к данным
Только бары
Отзывы покупателей
4.5
Отзывы: 2
5 | 50 % | |
4 | 50 % | |
3 | 0 % | |
2 | 0 % | |
1 | 0 % |
Отзывы покупателей
September 22, 2024
September 22, 2024
No reason to yolo this live without a few normal sessions, and M15 is enough for the first pass.
Обсуждение
Частые вопросы
BTCUSD
Forex
Indices
Commodities
Crypto
Stocks
XAUUSD
Продукты, доступные в cTrader Store, включая торговых ботов, индикаторы и плагины, предоставляются сторонними разработчиками и доступны исключительно в информационных и технических целях. cTrader Store не является брокером и не предоставляет инвестиционные консультации, персональные рекомендации или какие-либо гарантии будущей доходности.
Больше от этого автора


Цена
С 11/09/2024
7
Продажи