Mô tả
Chỉ báo Pinescriptlabs Store: Pinescriptlabs Store cBots : (cBot) Gold & BTC BreakoutSession Pivots(mới)
PRICE ACTION (Mới)
Thuật toán thông minh theo dõi (mới)
Hỗ trợ &
Kháng cự SmartTrend
Đường
Phân tích
Cấu trúc Thị trường
Động
của
Điểm
Quay đầu
Fibonacci
Hồi quy
Tuyến tính
Đa khung thời gian
Gap Giá Trị Công bằng Động lực
Theo dõi
Định hướng Nến
Đa cấp
Tự động
Hỗ trợ và
Kháng cự
Xu hướng
Đường
Tất cả
Hỗ trợ và
Kháng cự
Cấp độ
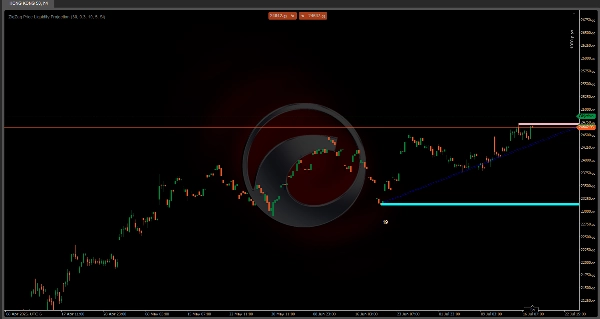
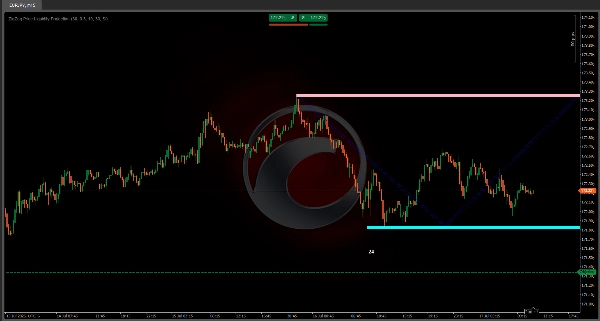
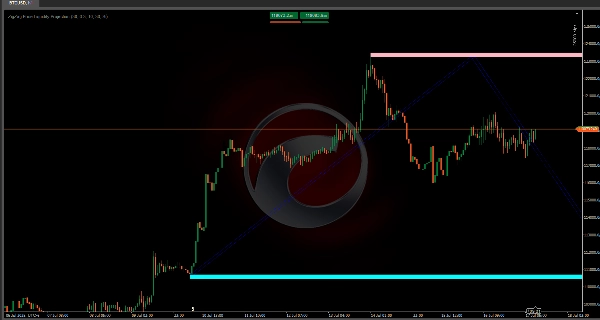
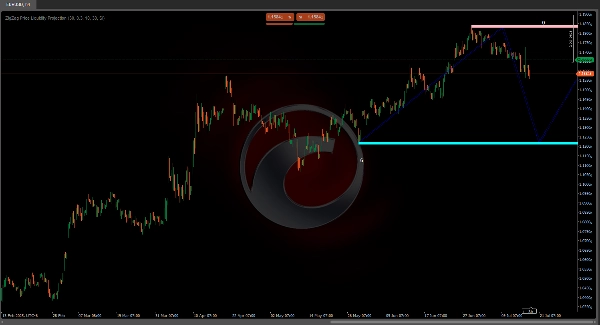
📊 Chỉ báo Dự báo Thanh khoản Giá ZigZag
"Xem nơi thị trường có thể quay đầu trước khi nó xảy ra!" 🔮
Chỉ báo này xác định các mức hỗ trợ/kháng cự chính 🛑 và dự đoán các vùng thanh khoản 💧 trên biểu đồ của bạn bằng cách sử dụng:
- 🔍 Điểm Pivot: Phát hiện các đỉnh và đáy quan trọng
- 📈 Biến động ATR: Đo lường biến động giá để điều chỉnh chính xác
- 💦 Dự báo Thanh khoản: Dự đoán các khu vực hoạt động cao (cụm mua/bán) thông qua các mẫu zigzag
🎯 Mục đích: Dự đoán các vùng phản ứng giá (bật lại/phá vỡ/điều chỉnh) để cải thiện quyết định vào/ra
✨ Ưu điểm của Zigzag
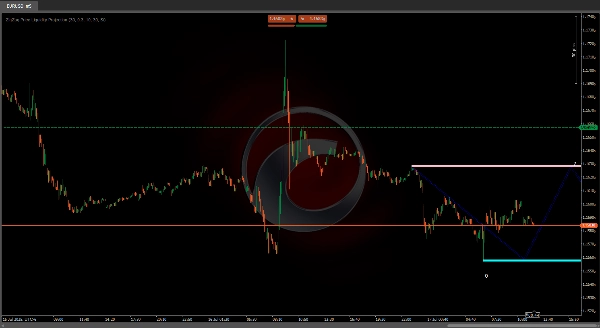
Những đường kết nối này hoạt động như một bản đồ kho báu 🗺️ cho thấy:
1️⃣ Các đường giá tương lai trong phạm vi xác định
2️⃣ Các vùng đảo chiều tiềm năng nơi giá có thể dừng hoặc đảo chiều
3️⃣ Điểm tham chiếu trực quan cho kế hoạch giao dịch
🚦 Tính năng chính:
- 📅 Hệ thống cảnh báo sớm cho các mức quan trọng
- 🎯 Dự báo các chuyển động tương lai dựa trên cấu trúc pivot (đường tăng/giảm)
- 🔢 Bộ đếm chạm (ví dụ, "24" = 24 lần kiểm tra lịch sử tại mức đó)
⚙️ Cài đặt được khuyến nghị
Cài đặtGiá trịHiệu ứng
Chu kỳ ATR
30
🎚️ Độ nhạy biến động
Chu kỳ Pivot
30
🔍 Phạm vi quan trọng của Pivot
⏳ Khung thời gian tốt nhất: biểu đồ 15 phút - 4 giờ ⏱️
💡 Mẹo chuyên nghiệp:
"Kết hợp với các mẫu nến 🕯️ để xác nhận! Zigzag cho biết NƠI giá có thể đi, nến cho biết KHI nào điều đó xảy ra."
🎯 Kết luận cuối cùng:
Một công cụ trực quan tất cả trong một mạnh mẽ để phát hiện:
✅ Vùng thanh khoản 💦
✅ Mức quan trọng 🎯
✅ Đường giá tương lai 🚀
Hoàn hảo cho các nhà giao dịch trong ngày muốn dự đoán các chuyển động thay vì đuổi theo chúng! 🏃💨