
Previous day Key Levels
Chỉ báo
394 lượt tải
Phiên bản 1.0, Oct 2025
Windows, Mac
4.0
Đánh giá: 1
Mô tả
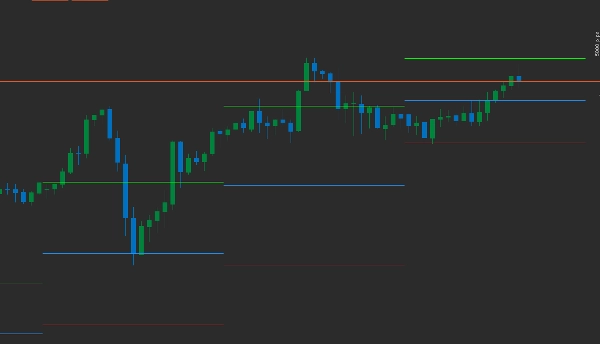
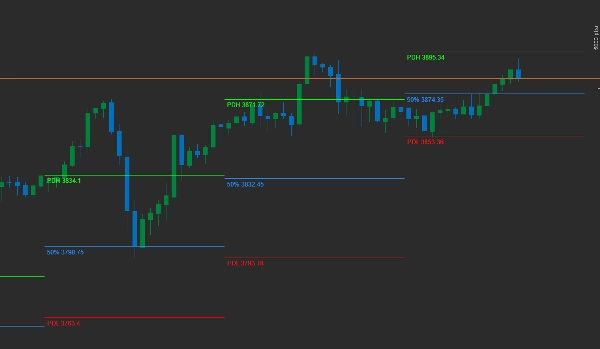
Chỉ báo này vẽ mức Cao, thấp của ngày trước và mức hồi quy 50%.
Người dùng có thể bật/tắt lịch sử
Khi bật lịch sử, bạn có thể chọn số ngày để xem.
Thay đổi màu sắc của từng đường
Bật/tắt nhãn xác định từng đường
Tóm tắt
Tóm tắt AI
The Previous Day Key Levels indicator plots the prior trading day's High, Low, and 50% retracement levels on the chart. Users can customize the display by enabling or disabling historical data and selecting the number of past days to view. The indicator allows color customization for each line and the option to show or hide labels identifying each level. It supports various markets and symbols including Forex pairs (EURUSD, GBPUSD, NZDUSD, USDJPY), cryptocurrencies (BTCUSD, crypto), commodities (XAUUSD, gold, oil, silver), indices (NAS100, Dow, S&P 500, DAX), and stocks. This tool is designed to assist traders in identifying key price levels from the previous day that may influence current market behavior.
Hồ sơ chỉ báo
Đánh giá của khách hàng
4.0
Đánh giá: 1
5 | 0 % | |
4 | 100 % | |
3 | 0 % | |
2 | 0 % | |
1 | 0 % |
Đánh giá của khách hàng
December 1, 2025
Previous Day Key Levels marks yesterday’s High, Low, Open, Close and midpoint - clean, fast and reliable. Great for intraday structure, liquidity zones and reaction points. Lightweight and useful on any timeframe. Alerts and range-zone shading would make it even better.
Thảo luận
Câu hỏi thường gặp
BTCUSD
Forex
Breakout
Indices
EURUSD
Commodities
GBPUSD
NZDUSD
Scalping
Crypto
Stocks
XAUUSD
NAS100
USDJPY
Các sản phẩm có sẵn trên cTrader Store, bao gồm bot giao dịch, chỉ báo và plugin, được cung cấp bởi các nhà phát triển bên thứ ba và chỉ nhằm mục đích cung cấp thông tin và tiếp cận kỹ thuật. cTrader Store không phải là nhà môi giới và không cung cấp lời khuyên đầu tư, khuyến nghị cá nhân hay bất kỳ đảm bảo nào về hiệu suất trong tương lai.
Sản phẩm khác của tác giả này


Bạn cũng có thể thích


Giá
Kể từ 30/01/2025
36.05M
Khối lượng đã giao dịch
26.73K
Pip đạt được
1.2K
Cài đặt miễn phí