Описание
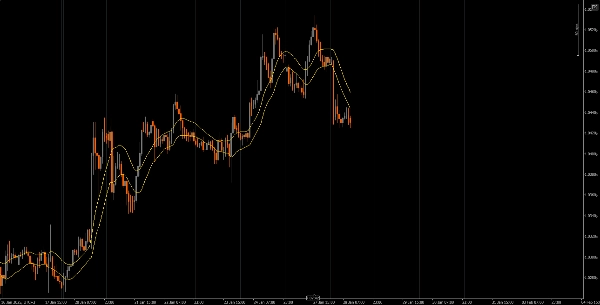
Настраиваемые скользящие средние (MA) на графике с использованием различных типов MA (простые, взвешенные, экспоненциальные) и источников ценовых данных (закрытие, открытие, максимум, минимум)
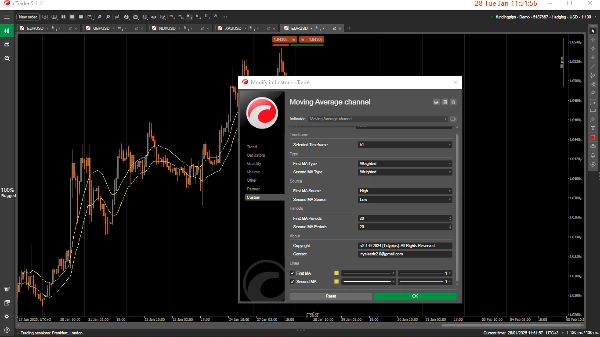
Индикатор WMA и SMA предоставляет гибкость в визуализации скользящих средних на основе параметров, заданных пользователем. Он поддерживает три типа скользящих средних: простые (SMA), взвешенные (WMA) и экспоненциальные (EMA). Пользователь может применять эти средние к различным источникам данных, таким как закрытие, открытие, максимум, минимум или вычисленные значения, такие как медиана, типичные и взвешенные цены.
Этот инструмент также позволяет выбрать временной интервал, на котором индикатор активен, что позволяет сосредоточиться на определённых периодах данных без загромождения графиков лишней информацией.
Ознакомьтесь с другими полезными индикаторами, которые я опубликовал. Если этот или любой другой мой индикатор оказался для вас полезным, рассмотрите возможность поддержки моей работы покупкой или пожертвованием. Ваша поддержка не только помогает мне продолжать разработку и улучшение этих инструментов, но и обеспечивает возможность создавать новые, ценные индикаторы для улучшения вашего торгового опыта. Спасибо за вашу постоянную поддержку!
https://buymeacoffee.com/tidypips