
Drawing Utility
Chỉ báo
208 lượt tải
Phiên bản 1.0, Jul 2025
Windows, Mac
Mô tả
Alt + Kéo để kích hoạt nó trên biểu đồ của bạn.
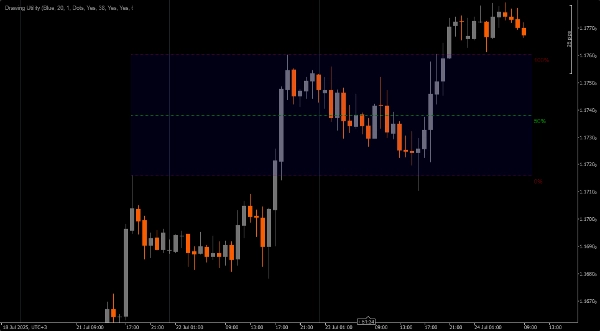
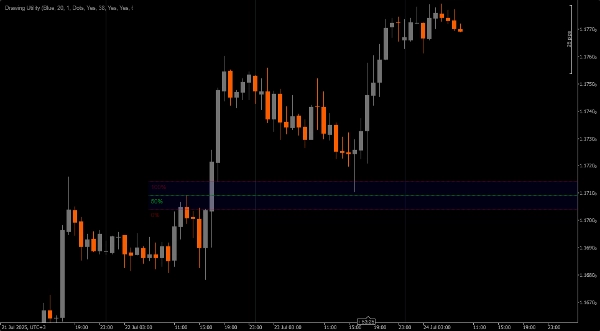
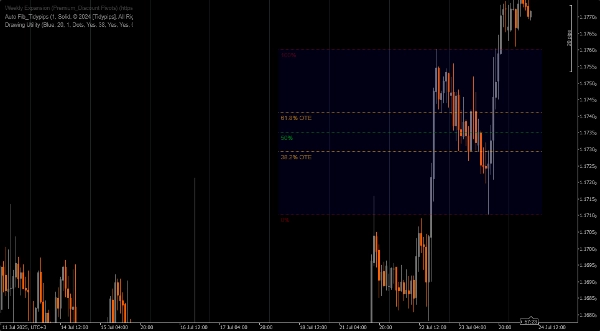
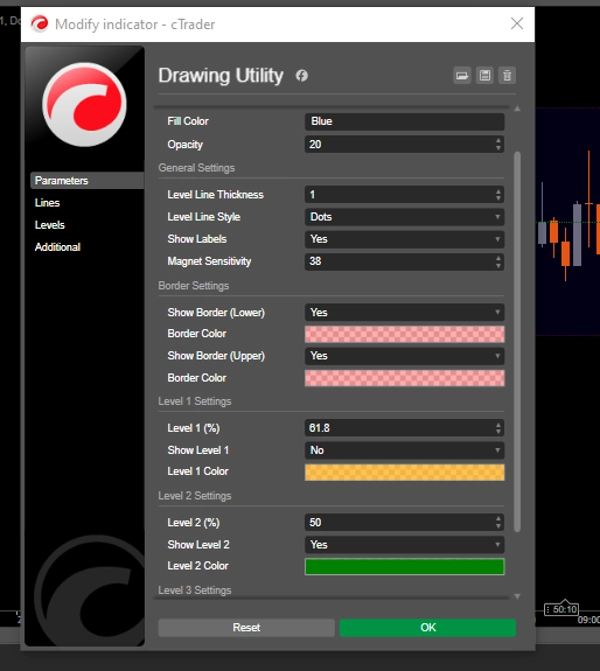
Tiện ích vẽ có thể tùy chỉnh.
1. Truy cập nhanh Fibonacci.
2. Đánh dấu Khoảng cách Giá Công bằng
3. Công cụ đo lường
4. Đánh dấu Điểm Quan tâm
5. hoặc bất kỳ mục đích sử dụng nào khác (Tôi chưa nghĩ đến) bạn có thể thấy phù hợp để chú thích biểu đồ của mình
LƯU Ý **Alt + Kéo để kích hoạt nó trên biểu đồ của bạn.**
Tóm tắt
Tóm tắt AI
Drawing Utility is a customizable chart annotation tool designed for trading platforms. It features a rectangular box with five adjustable Fibonacci levels, which can also be customized to user-defined values. The utility is activated by pressing Alt and dragging on the chart. Key functionalities include quick access to Fibonacci retracement levels, marking Fair Value Gaps, measuring price movements, and highlighting Points of Interest. Additionally, it supports flexible use cases for various chart annotations, allowing traders to tailor it to their specific analysis needs.
Hồ sơ chỉ báo
Đánh giá của khách hàng
0.0
Đánh giá: 0
Đánh giá của khách hàng
Sản phẩm này chưa có đánh giá nào. Bạn đã dùng thử chưa? Hãy là người đầu tiên chia sẻ với mọi người!
Thảo luận
Câu hỏi thường gặp
Các sản phẩm có sẵn trên cTrader Store, bao gồm bot giao dịch, chỉ báo và plugin, được cung cấp bởi các nhà phát triển bên thứ ba và chỉ nhằm mục đích cung cấp thông tin và tiếp cận kỹ thuật. cTrader Store không phải là nhà môi giới và không cung cấp lời khuyên đầu tư, khuyến nghị cá nhân hay bất kỳ đảm bảo nào về hiệu suất trong tương lai.
Sản phẩm khác của tác giả này


Giá
15
Lượt bán
4.61K
Cài đặt miễn phí