
说明
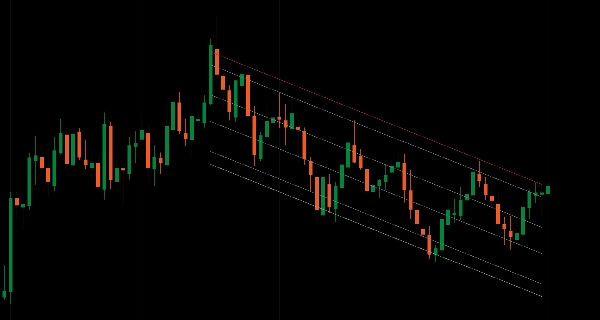
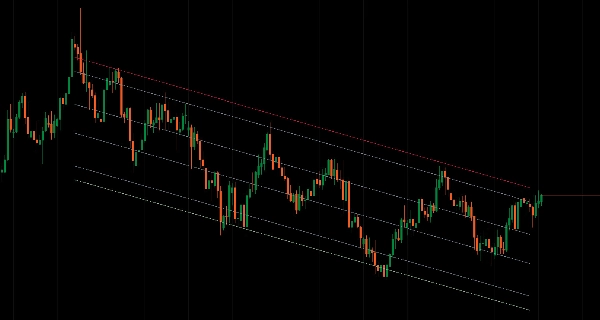
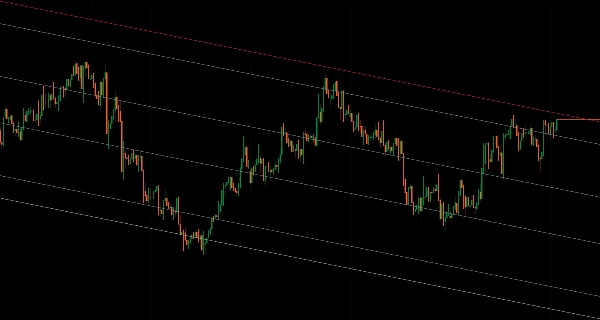
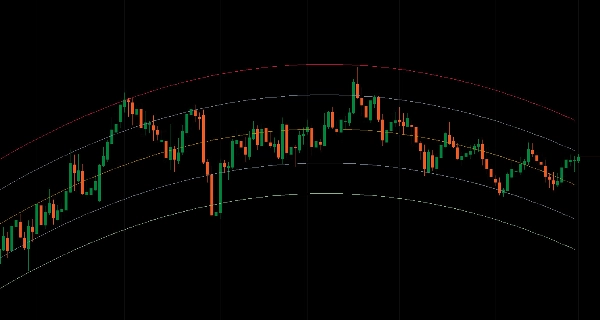
跨多种计算类型、时间框架和日期范围的带有斐波那契水平的统计回归通道。
使用八种方法(线性、对数、指数、加权、多项式、移动、指数移动、LOWESS)拟合价格数据的回归线,并带有标准差带用于均值回归分析。
九个斐波那契通道水平(0% 到 100%),跨16个周期的多时间框架分析,带插值渲染,三种计算模式(基于周期、日期范围、多时间框架),多项式次数控制(1-5)用于曲线趋势结构,标准差乘数用于通道宽度调整,支持时区感知的日期时间解析以进行事件分析,趋势线无限延伸投影,以及优化的LRU缓存,为交易者提供全面的统计回归分析,帮助其在各种市场条件下定位均值回归区和曲线价格结构。
功能特性
8种回归计算类型
- 线性:经典最小二乘线性回归
- 对数:基于自然对数的回归,适用于指数价格变动
- 指数:指数曲线拟合,用于加速趋势
- 加权:对最近的K线赋予更大权重的线性回归
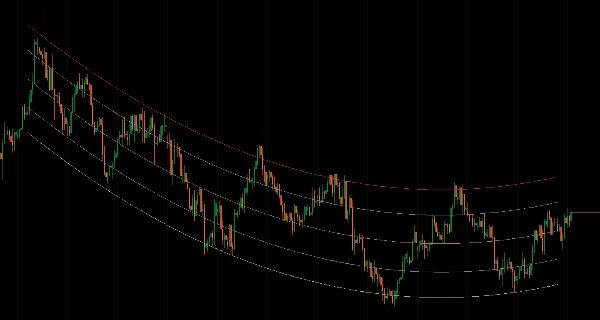
- 多项式:用于非线性趋势的曲线拟合(次数1-5)
- 移动:基于移动平均的回归
- 指数移动:基于EMA的回归,用于趋势平滑
- LOWESS:局部加权回归,用于自适应平滑
9个斐波那契通道水平
- 完整通道范围:100%(上方)、88.6%、76.4%、61.8%、50%(中线)、38.2%、23.6%、11.4%、0%(下方)
- 回归带内的均值回归区域
- 精确的支撑/阻力参考点
- 每个水平独立的颜色/样式/粗细控制
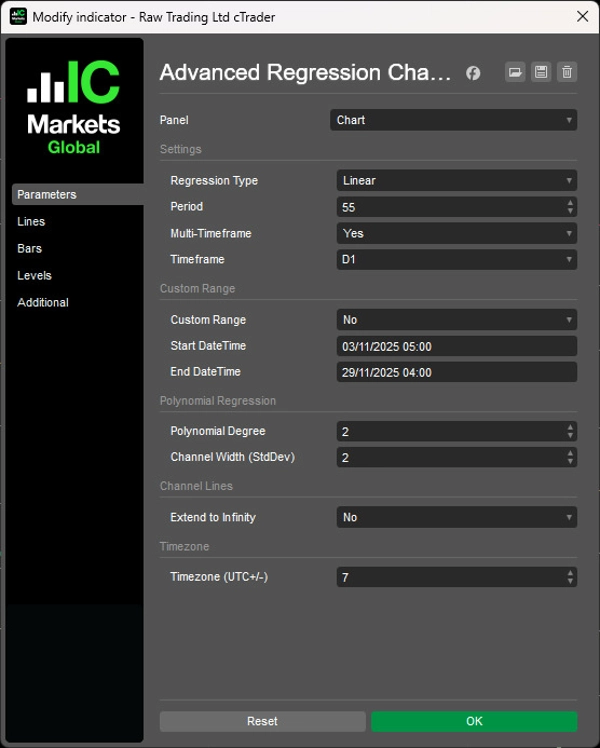
多时间框架分析
- 在更高时间框架上计算回归,显示于当前图表
- 提供16个时间框架(从m1到月线)
- 通道值插值,确保图表K线间平滑渲染
- 无需切换图表即可查看更高时间框架结构
3种计算模式
- 基于周期:滚动窗口N根K线(默认)
- 日期范围:自定义开始/结束日期时间,用于特定事件或阶段,支持时区感知的日期时间解析(UTC+/-偏移)
通道显示选项
- 标准输出:将所有9个水平绘制为指标线
- 无限延伸:渲染为无限向前投射的趋势线
- 颜色/样式更改时自动刷新
- 干净渲染——计算窗口外无残留值
日期范围模式
- 定义精确的开始/结束日期(dd/MM/yyyy HH:mm格式)
- 分析特定市场事件、阶段或结构
- 独立于周期参数
- 从用户本地时间转换到服务器时间的时区转换
动态计算
- 新K线形成时实时更新
- 优化的LRU缓存,带脏区跟踪
- 基于时间框架的自适应缓存大小
- 二分查找实现快速日期范围查询
通道宽度控制
- 标准差乘数(默认2.0)
- 波动性扩张时更宽的通道带
- 区间震荡市场时更紧的通道带
- 所有回归类型均一致
多项式回归
- 次数控制:1-5(次数越高,曲率越大)
- 捕捉非线性趋势
- 适用于抛物线或曲线价格结构
- 次数为1时退回线性回归
清晰的视觉管理
- 不对形成中的K线进行计算——仅对已完成的K线计算
- 正确的多时间框架截断——线条在最后一个完成的高时间框架K线处结束
- 基于斜率的外推,实现一致的方向投影
- 清晰的输出序列,带有描述性水平名称
__________________________________________________________________________________________
更多免费指标
探索广泛的市场分析工具——从结构和成交量到回归、波动率和自定义时间框架。
源代码可在GitHub 仓库获取。
全部免费使用。但如果您愿意支持咖啡费用,可以通过 这里捐助。
支撑/阻力
成交量
移动平均线
实用工具/自定义
基于回归
波动率
振荡器
__________________________________________________________________________________________
免责声明
交易存在风险。此指标仅用于技术分析——请始终应用适当的风险管理并负责任地交易。
反馈与改进
如果您有建议、功能请求或改进想法,请在讨论标签页留言。您的反馈有助于提升此指标,造福所有用户。
摘要
It offers multi-timeframe analysis across 16 periods (from 1 minute to monthly), enabling regression calculations on higher timeframes displayed on the current chart with smooth interpolated rendering. Users can select among three calculation modes: Period-Based (rolling window), Date Range (custom start/end with timezone-aware parsing), and Multi-Timeframe. Channel width is adjustable via a standard deviation multiplier to reflect market volatility.
The indicator features real-time dynamic updates, optimized caching for performance, and extend-to-infinity trendline projections for forward-looking analysis. Visual output is clean, with slope-based extrapolation and no calculations on forming bars. This tool is designed for traders analyzing mean reversion and complex price structures across various market conditions.


