
Mô tả
Chán ngấy việc mất cả ngày để đánh dấu biểu đồ của bạn? Chỉ báo này làm điều đó cho bạn cực nhanh.
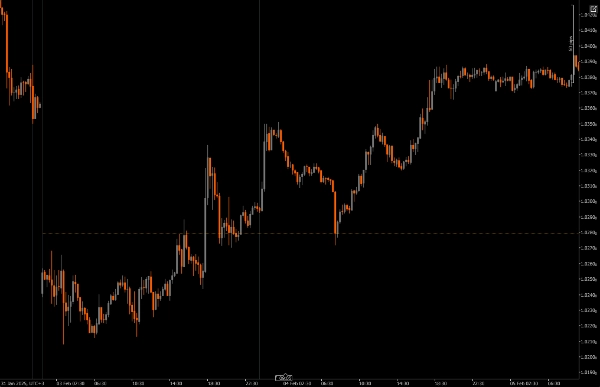
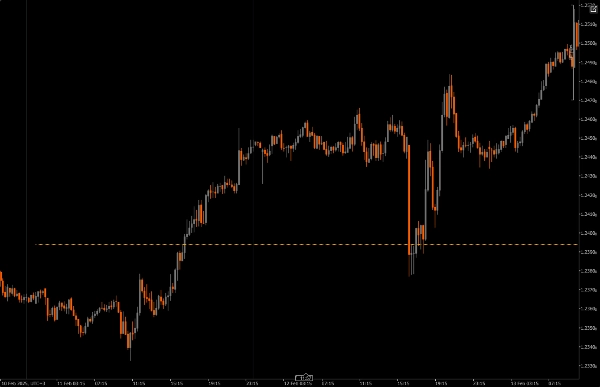
Nó tìm điểm giữa giữa mức cao và thấp của ngày trước đó, và vẽ nó lên biểu đồ của bạn. Giờ bạn có thể quét biểu đồ cực nhanh. Dễ dàng thôi!
Một số tính năng thú vị
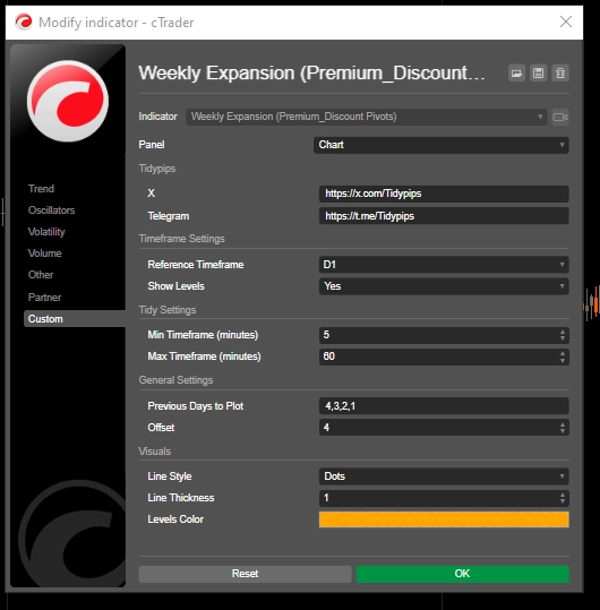
Khung thời gian tham chiếu tùy chỉnh: Bạn có thể chọn khung thời gian tối thiểu và tối đa để vẽ các mức giá quan trọng, giúp bạn căn chỉnh các giao dịch trong ngày với xu hướng thị trường rộng hơn.
Điều làm cho chỉ báo này đặc biệt là khả năng theo dõi nến tuần khi nó được in ra từng ngày, giúp dễ dàng bắt được sự mở rộng của nến tuần.
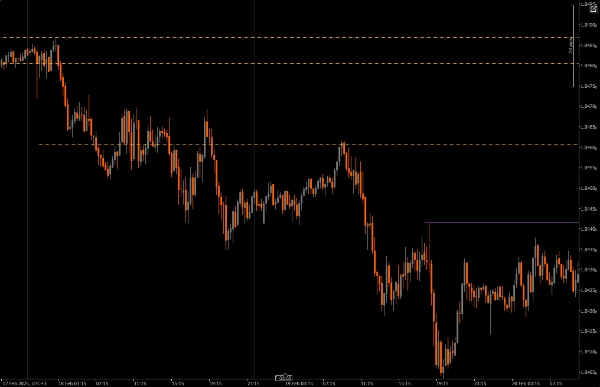
Tham số Offset: Tính năng này cho phép bạn quyết định mức độ kéo dài của các mức được vẽ vào tương lai, giúp bạn có cái nhìn rõ hơn về các vùng tiềm năng tiếp tục giá trong tương lai.
Tùy chỉnh hình ảnh: Bạn có nhiều tùy chọn để điều chỉnh kiểu đường, độ dày và màu sắc, giúp dễ dàng tạo biểu đồ phù hợp với phong cách cá nhân và dễ đọc.
Hạn chế khung thời gian: Chỉ báo bao gồm các kiểm tra để đảm bảo nó chỉ hoạt động trong các cài đặt khung thời gian bạn chỉ định, giúp tránh làm rối biểu đồ khi bạn chuyển qua các khung thời gian khác.
Điểm cần lưu ý:
Một yêu thích cá nhân
Bạn có giống tôi và không thể rời mắt khỏi các đường kẻ trên biểu đồ, thì hãy thử chỉ báo này. Có hạn chế khung thời gian và chức năng khoảng nhìn lại nhằm giảm bớt sự lộn xộn trên biểu đồ.
Chỉ báo này hữu ích trong việc theo dõi sự phát triển của nến tuần; Nếu sự mở rộng tuần thể hiện dấu hiệu của dòng lệnh tăng thì các mức pivot trên chỉ báo này hình dung các khu vực hoặc vùng để tham gia vào sự mở rộng tăng tương tự, nếu sự mở rộng tuần thể hiện dòng lệnh giảm thì các mức pivot trên chỉ báo này hình dung các khu vực hoặc vùng để tham gia vào sự mở rộng giảm.
Cài đặt: Bắt đầu bằng cách tải xuống và cài đặt Previous Day Equilibrium trên nền tảng cAlgo của bạn.
Thiết lập: Mở cài đặt để chọn khung thời gian tham chiếu, chọn số ngày trước bạn muốn vẽ, và tùy chỉnh các cài đặt hình ảnh theo ý thích.
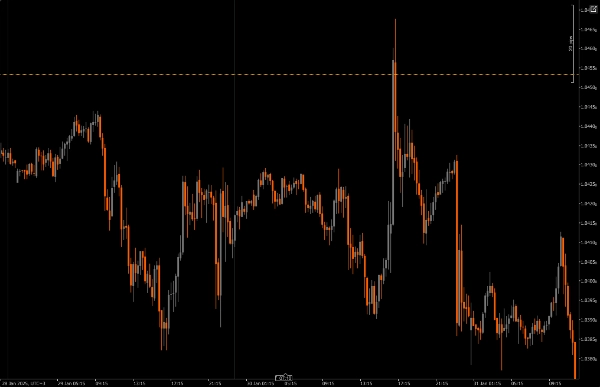
Phân tích: Khi giao dịch, hãy chú ý đến các mức được vẽ trên biểu đồ của bạn. Những mức này chỉ ra nơi giá có thể đảo chiều dựa trên hành động giá lịch sử, giúp bạn đưa ra quyết định thông minh hơn.
Thực thi: Sử dụng các mức này để xác định điểm vào và ra, cũng như các lệnh dừng lỗ và chốt lời, tích hợp chúng vào chiến lược giao dịch tổng thể của bạn.
Công cụ hỗ trợ được khuyến nghị:
cTrader: Đây là nền tảng tốt nhất để sử dụng Previous Day Equilibrium, mang lại trải nghiệm mượt mà cho việc tùy chỉnh và phân tích.
Công cụ phân tích kỹ thuật: Kết hợp chỉ báo này với các công cụ khác như trung bình động hoặc bộ dao động để có cái nhìn toàn diện hơn về xu hướng thị trường.
Công cụ quản lý rủi ro: Sử dụng các máy tính và công cụ dừng lỗ để giúp quản lý rủi ro hiệu quả khi giao dịch quanh các mức quan trọng này.
Bằng cách sử dụng Previous Day Equilibrium cùng với các công cụ này, bạn có thể nâng cao chiến lược giao dịch và tăng cơ hội thành công trong thế giới giao dịch trong ngày nhanh chóng.
Tóm tắt
Đánh giá của khách hàng
5 | 0 % | |
4 | 100 % | |
3 | 0 % | |
2 | 0 % | |
1 | 0 % |


