

present
Daftar dan dapatkan diskon $50 untuk pembelian pertama Anda
Trading product for MyZTrade High TF candle v1.0 Indikator Inside Bar Engulfing, image 1
MyZTrade High TF candle v1.0
Indikator
Versi 1.0, Aug 2026
Windows, Mac
Trading product for MyZTrade High TF candle v1.0 Indikator Inside Bar Engulfing, image 2
Sejak 28/06/2025

Deskripsi

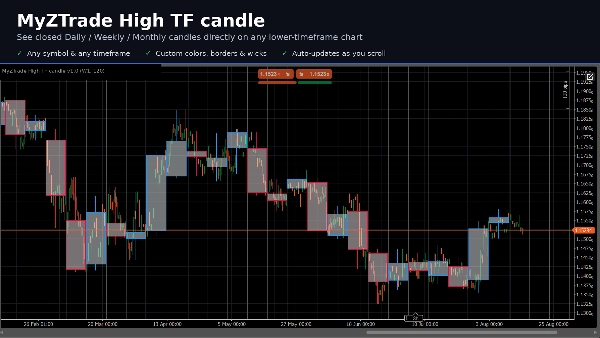
MyZTrade High TF candle adalah alat visualisasi multi-timeframe yang menampilkan lilin timeframe lebih tinggi yang sudah selesai (Harian, Mingguan, atau Bulanan — dapat dipilih) langsung di grafik Anda saat ini sebagai kotak berwarna dengan badan, batas, dan sumbu tinggi/rendah, mirip dengan melihat lilin D1 atau W1 tanpa harus mengganti grafik.

Hanya lilin timeframe lebih tinggi yang sudah tertutup yang digambar. Lilin yang masih terbentuk sengaja dilewati, sehingga kotak tidak pernah berubah bentuk saat periodenya masih terbuka — kotak muncul hanya setelah periode tersebut benar-benar tertutup.

Jenis indikator: overlay multi-timeframe / alat konteks aksi harga. Bekerja pada simbol apa pun dan timeframe lebih rendah apa pun (misalnya M15, H1, H4).

Fitur utama:

  • Timeframe lebih tinggi dapat dipilih: Harian, Mingguan, atau Bulanan
  • Jumlah kotak yang terlihat dapat dikonfigurasi, sehingga beban grafik tetap terkendali pada riwayat panjang
  • Warna isi dan batas terpisah untuk lilin bullish dan bearish
  • Opsional sumbu tinggi/rendah pada setiap kotak
  • Secara otomatis menggambar ulang saat Anda menggulir grafik

Kasus penggunaan trading: membaca zona support/resistance timeframe lebih tinggi dan bias harian atau mingguan saat melakukan eksekusi pada timeframe lebih rendah, serta mempelajari bagaimana harga berperilaku di dalam rentang timeframe lebih tinggi yang sudah selesai tanpa harus bolak-balik mengganti grafik.

Ringkasan

Ringkasan AI
MyZTrade High TF candle is a multi-timeframe visualization indicator designed to overlay completed higher-timeframe candles—Daily, Weekly, or Monthly—directly onto a lower timeframe chart (e.g., M15, H1, H4). It displays these higher timeframe candles as colored boxes with distinct bodies, borders, and optional high/low wicks, providing a clear view of higher timeframe price action without switching charts. Only fully closed higher timeframe candles are shown, ensuring that the displayed boxes remain static and do not change shape during the current period. Users can configure the number of visible boxes to manage chart load and customize separate fill and border colors for bullish and bearish candles. The indicator automatically redraws when scrolling the chart. This tool aids traders in identifying higher timeframe support and resistance zones and assessing daily or weekly market bias while executing trades on lower timeframes. It supports any symbol and serves as a price-action context tool for enhanced multi-timeframe analysis.
Profil indikator

Ulasan pelanggan

0.0
Ulasan: 0
Ulasan pelanggan
Belum ada ulasan untuk produk ini. Sudah mencobanya? Jadilah pemberi ulasan pertama!

Diskusi

Pertanyaan umum

Inside Bar
Engulfing
Fair Value Gap
BOS
Imbalance
CHOCH
Support & Resistance
Produk-produk yang tersedia melalui cTrader Store, termasuk bot trading, indikator, dan plugin, disediakan oleh pengembang pihak ketiga serta hanya ditujukan untuk akses teknis dan informasi. cTrader Store bukan broker dan tidak menyediakan saran investasi, rekomendasi pribadi, atau jaminan apa pun tentang kinerja di masa mendatang.

Produk lain dari penulis ini

Indikator
Volume
Key Levels
+4
Margin Zones its CME-based support/resistance levels from price extremes, helps traders spot entries and exits NKZ zones
Indikator
Channel
Fibonacci
+5
Market maker levels from key price extremes — catch major reversals and corrections in one click. ver1.2
Indikator
ATR
EMA
+5
The indicator displays potential reversal zones (support/resistance) on the chart based on the average range (High–Low)

Anda mungkin juga suka

Indikator
Prop
Forex
+14
Stochastic Momentum Index (SMI) for cTrader optional higher-timeframe source, and clear overbought/oversold levels.
Indikator
RSI
Forex
+12
Indicator pattern signal moment
Indikator
Highlights market sessions & overlaps with real-time range & volume stats – perfect for pro scalpers.
Indikator
Prop
Forex
+13
Color Volume Bars – Visualize Market Strength Instantly
Indikator
BOS
MSS
+5
One indicator, full ICT/SMC picture — structure, OBs, FVGs, liquidity, Premium/Discount — with graded PRIME/SETUP signal
Indikator
MACD
Key Levels
+2
Trend indicator with multi-timeframe filters, generating signals only on fully completed bricks & candles. No Repaint.
Logo "SupertrendChannels"
Peringkat teratas
4.7
(4)
$19
/
$20
Indikator
Supertrend-based channel for entries, trailing stops, and dynamic support/resistance zones.
Logo "QX SmartStructure"
Peringkat teratas
4.7
(4)
$26
/
$50
Indikator
AI
ATR
+26
SMC without the mess: Clean structure + auto-managing FVGs + MTF panel. Hard-right-edge, step size-based for any symbol.
Indikator
EMA
A visual signal backtester that simulates trades directly on your chart and scores strategy performance.
Indikator
ATR
Channel
+1
Bollinger Bands Advanced Squeeze & Breakout System, Real-Time On-Chart Dashboard, Auto-Squeeze Detector, Dual-Band Cloud
Indikator
Allow trader to draw multi trendlines in different timeframes on one chart,Give trader an overview of the current market
Indikator
ATR
Forex
+5
🚀 Buy and sell signals 📈📉 only when three independent engines agree simultaneously.
Indikator
Support & Resistance
Detects Gartley, Bat, Butterfly, Crab, Shark & Cypher patterns and backtests each one's real win rate.
Logo "E7 BBKG Indicator"
Peringkat teratas
4.5
(4)
$25
/
$50
Indikator
Prop
E7 BBKG indicator with 80% plus accuracy used to show both, possible reversal and trend.
Indikator
SMC
Prop
+4
📈 Trading Sessions Indicator — London, New York & Tokyo Visualize Key Market Sessions + High/Low Levels with Precision
Indikator
ATR
BOS
+4
Based on market structure and draws liquidity zones, institutional flows, and consolidation ranges. Smart Money Concepts
Indikator
AI
ATR
+26
MacD Custom Indicator-Multiple Time Frame
Indikator
Breakout
Institutional Flow Radar scans the chart for abnormal volume events and classifies them into two groups: Capital &Public

Harga

Sejak 28/06/2025




















