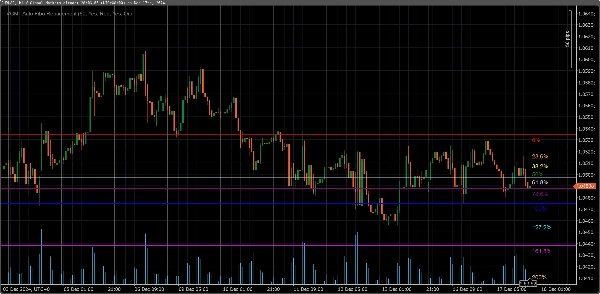
VGM - Auto Fibo Retracement
Logo de "VGM - Auto Fibo Retracement"
4.5
03/09/2025
824
Desktop
Depuis le 17/12/2024
Installations gratuites
824
Image mise en ligne de "VGM - Auto Fibo Retracement"

This Auto Fibonacci Retracement Indicator automatically calculates and draws Fibonacci retracement levels on the chart based on the highest high and lowest low within a customizable lookback period. Users can configure colors and enable/disable specific Fibonacci levels, including popular extensions above 100% such as 127.2%, 161.8%, 200%, and 261.8%.

Key Features:
1. **Automatic Swing Detection**: Detects swing highs and lows dynamically within the chosen lookback period.
2. **Customizable Levels**: Enable/disable specific Fibonacci levels as per preference.
3. **Color Settings**: Choose individual colors for each level for better visual distinction.
4. **Extended Levels**: Includes commonly used extensions (127.2%, 161.8%, 200%, and 261.8%) for trend continuation analysis.
5. **Real-Time Updates**: Levels automatically adjust to changes in market conditions.

Ideal For:
- Traders using Fibonacci retracement and extensions for entry/exit levels.
- Users who need a clean, flexible, and automated Fibonacci tool.


Build by VantoFX. https://vantofx.com Free for all.

4.5
Avis : 2
5
50 %
4
50 %
3
0 %
2
0 %
1
0 %
Avis clients
August 10, 2025
This is helpful my friend, thanks for the upload :)
July 9, 2025
Pros: Automatically detects swing points and plots Fibonacci retracement levels. Easy to use, customizable, works across timeframes. Cons: No tooltips or alerts. Lacks template saving and historical swing tracking. Requires additional confirmation tools for reliable trading.
Vous pourriez aussi aimer
Indicateur
NAS100
NZDUSD
Breakout
+12
Initial Balance Breakout Signals
📈 Initial Balance Breakout Signals: visually accurate IB levels, breakout alerts & forecast zones for smart trading.
Clarosti
Clarosti a chave para decisões inteligentes no mercado
Indicateur
Indices
Prop
Stocks
+5
New Way Sar - Free
The Parabolic SAR, or "Stop and Reverse," is a dynamic technical analysis tool
VegaXLR - Analysis Tools Alerts
Enhance your trading with customizable alerts and dynamic visual tools for trendlines, Fibonacci levels, and more.
Indicateur
RSI
Signal
MACD
[Stellar Strategies] Moving Averages Combined 1.0
Smooths price action with 6 MAs (3 SMA, 3 EMA). Reduces noise, clarifies trends 📈📉
rvwap v1
Rolling VWAP with dynamic or fixed time window, customizable source price and standard deviation bands.
Indicateur
Forex
EURUSD
GBPUSD
AlgoCorner McGinley Dynamic
Designed to follow price more naturally, adjusting automatically to market speed, to reduce lag and false signals.
Fibonacci Prediction Channel
Designed to plot a future prediction channel based on Fibonacci retracement levels 📊
Indicateur
NAS100
XAUUSD
Commodities
+11
SCOB
SCOB - Single Candle Order Block Indicator
trPDHLC
this indicator shows previous day high low and closed with precise manner.
Indicateur
Grid
Indices
Breakout
+8
TSPivotSMC
Pivot Point MultiTimeFrame with Order Block
50 percent
This indicater is a magical impact which shows exactly high and low with 100% results
Volume-Powered Market Flow Projector
Project market behavior by integrating price and volume data across multiple time dimensions
Indicateur
Indices
Commodities
Forex
Smart Floating Risk - Premium version
The Floating Risk Indicator is an essential tool for traders who prioritize risk management.
Indicateur
Signal
MACD
TradingViewMACD
Enhance your trading strategy with our customizable TradingViewMACD indicator. Optimize and elevate your market analysis
Indicateur
Commodities
Forex
Crypto
+1
timer
This is a simple indicator to show the remaining time of a candle
Indicateur
Breakout
3 Bar Triangle by Linda Raschke
3 bar triangle = high below 2 day high, low above 2 day low
Indicateur
Forex
Supertrend
Signal
AlgoCorner 1-100 Moving Averages
Draw as many Moving Averages as you need from a simple indicator.