Description
LogicLadder Pivots – Scanner avancé de structure de marché et de motifs
Déverrouillez la structure cachée du marché avec LogicLadder Pivots.
L'indicateur LogicLadder Pivots est un outil professionnel d'action des prix conçu pour aider les traders à visualiser la structure du marché, identifier les tendances et repérer automatiquement des motifs de retournement à haute probabilité. En combinant la logique classique ZigZag avec une surveillance multi-échelle avancée, cet outil agit comme votre analyste de marché personnel, gardant vos graphiques propres tout en vous alertant des mouvements de prix critiques.
🚀 Fonctionnalités clés
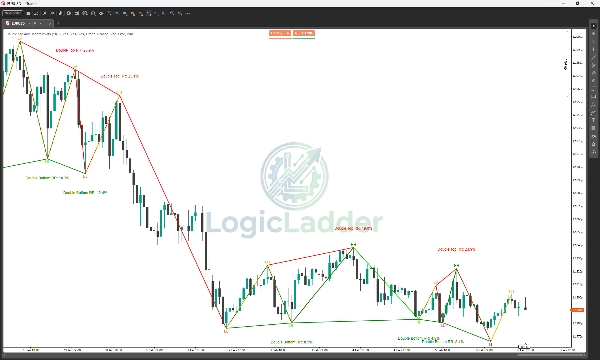
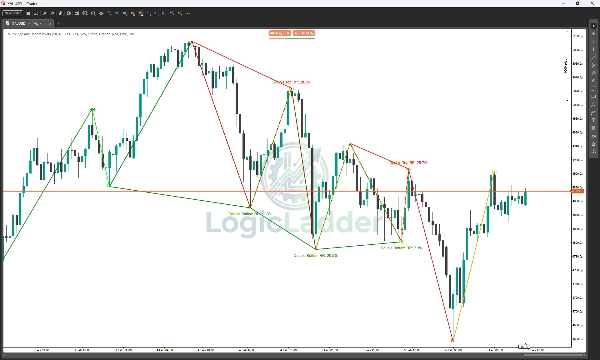
- Structure de marché automatisée : Étiquette automatiquement les Plus Hauts (HH), Plus Bas (LH), Plus Hauts (HL), et Plus Bas (LL), vous donnant une lecture instantanée de la direction actuelle de la tendance.
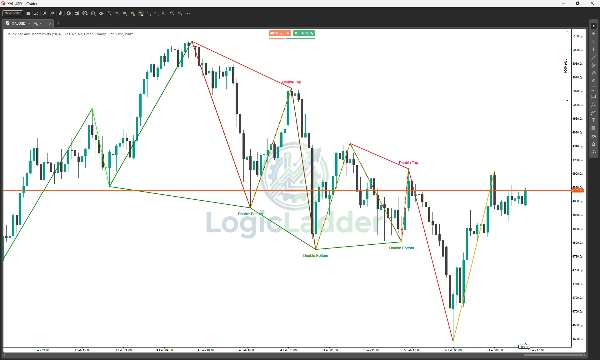
- Détection intelligente de motifs : Analyse en temps réel les formations de Double Top et Double Bottom. Il ne se contente pas de trouver des motifs ; il les filtre en fonction d'un ratio Risque-Rendement (RR) calculé pour vous assurer de ne voir que les configurations les plus exploitables.
- Alertes multi-échelles (MTF) : Surveillez une échelle de temps supérieure (par ex., H4 ou Daily) tout en tradant sur une échelle inférieure. L'indicateur vous alertera lorsque des pivots clés se forment sur votre échelle de surveillance, garantissant que vous ne tradez jamais à contre-courant de la tendance majeure.
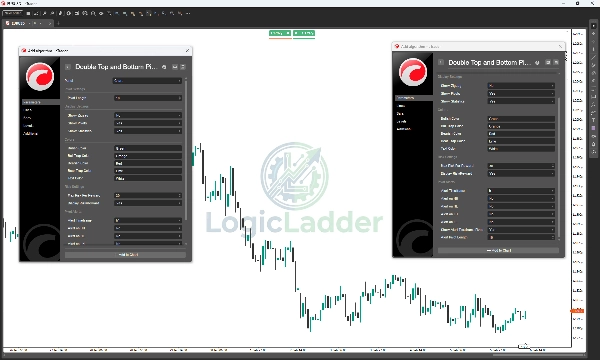
- Panneau de statistiques interactif : Un tableau de bord clair, intégré au graphique, affiche le statut actuel de la détection des motifs (Analyse en cours, Double Top détecté, etc.).
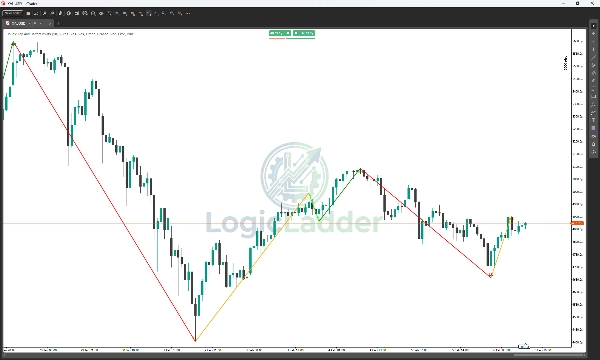
- Visualisation ZigZag : Trace des lignes de tendance claires et personnalisables qui filtrent le bruit, vous aidant à vous concentrer sur les mouvements de prix significatifs.
- Entièrement personnalisable : Adaptez chaque aspect de l'indicateur à votre style de trading. Ajustez la sensibilité des pivots (Longueur), changez les couleurs pour les structures haussières/baissières, et activez ou désactivez les éléments visuels distincts.
🎨 Guide visuel & stratégie de couleurs
Le système LogicLadder utilise un code couleur spécifique à 4 couleurs pour vous raconter instantanément l'histoire de la structure du marché. Voici comment lire "l'Échelle" :
1. 🟢 Vert (Haussier - Fort)
- Ce que c'est : Utilisé pour les Plus Hauts (HH).
- Ce que cela signifie : Les acheteurs ont le contrôle total. Le marché atteint de nouveaux sommets.
- Action : Cherchez des opportunités d'achat ou conservez vos positions longues existantes.
2. 🔴 Rouge (Baissier - Fort)
- Ce que c'est : Utilisé pour les Plus Bas (LL).
- Ce que cela signifie : Les vendeurs ont le contrôle total. Le marché chute vers de nouveaux creux.
- Action : Cherchez des opportunités de vente ou conservez vos positions courtes existantes.
3. 🟠 Orange (Piège haussier - Faiblesse)
- Ce que c'est : Utilisé pour les Plus Bas (LH).
- Ce que cela signifie : Les acheteurs ont tenté de pousser le prix à la hausse mais n'ont pas réussi à dépasser le sommet précédent. C'est un "Piège haussier" — les acheteurs tardifs sont maintenant piégés alors que l'élan faiblit.
- Action : Signe d'alerte ! Si vous êtes en position longue, envisagez de prendre des profits. Surveillez un potentiel retournement de tendance à la baisse.
4. 🟢 Citron vert (Piège baissier - Force)
- Ce que c'est : Utilisé pour les Plus Hauts (HL).
- Ce que cela signifie : Les vendeurs ont tenté de pousser le prix à la baisse mais n'ont pas réussi à casser le creux précédent. C'est un "Piège baissier" — les vendeurs tardifs sont piégés alors que le support tient.
- Action : Signe d'opportunité ! Cela signale souvent le début d'une nouvelle tendance haussière. Surveillez les signaux d'entrée pour aller en position longue.
📉 Comment trader "l'Échelle"
- Mode tendance haussière : Vous souhaitez voir un motif de Vert (HH) relié à Citron vert (HL). Cela confirme une échelle ascendante saine.
- Mode tendance baissière : Vous souhaitez voir un motif de Rouge (LL) relié à Orange (LH). Cela confirme une échelle descendante raide.
- Détection de retournement :
-
- Sommet potentiel : Si vous voyez un Vert (HH) suivi immédiatement d'un Orange (LH), la tendance haussière perd de l'énergie.
- Creux potentiel : Si vous voyez un Rouge (LL) suivi immédiatement d'un Citron vert (HL), la pression vendeuse est épuisée.
💡 Comment ça fonctionne
- Analyse des pivots : L'indicateur analyse une période de retour définie par l'utilisateur (par défaut : 10 barres) pour identifier les hauts et bas significatifs.
- Logique de tendance : Il connecte ces points pour visualiser "l'Échelle" des prix — vous montrant exactement quand une tendance casse la structure ou respecte le support/la résistance.
- Confirmation de retournement : Lorsque l'action des prix forme une structure "W" (Double Bottom) ou "M" (Double Top) qui répond à vos critères de Risque/Rendement, l'indicateur dessine le motif sur le graphique et met à jour le panneau de statut.
🔔 Alertes & notifications
Restez informé sans fixer l'écran. LogicLadder Pivots inclut un système d'alerte robuste :
- Alertes de journal : Messages détaillés imprimés dans le journal cTrader lorsque des motifs ou pivots se produisent.
- Surveillance MTF : Recevez une notification lorsqu'un Pivot Haut ou Bas structurel se forme sur votre échelle de temps d'alerte choisie (par ex., recevez une alerte pour un Pivot Bas 4 heures tout en scalpant sur le graphique 5 minutes).
⚙️ Paramètres
- Longueur du pivot : Sensibilité de la détection des oscillations.
- Décalage des étiquettes : Ajustez la distance des étiquettes de texte par rapport aux mèches des chandeliers pour une meilleure visibilité.
- Risque maximum par rendement : Filtrez les motifs en fonction de leur efficacité (par défaut : 30%).
- Échelle de temps d'alerte : Choisissez une échelle de temps secondaire à surveiller.
- Paramètres visuels : Contrôle total des couleurs pour les mouvements haussiers, baissiers et pièges.
Résumé
The indicator detects Double Top and Double Bottom reversal patterns in real-time, filtering them by a calculated Risk-to-Reward ratio to highlight the most actionable setups. It supports alerts for pivot formations on higher timeframes while trading on lower ones, helping users align trades with major trends.
A customizable on-chart stats panel displays the current pattern detection status, and clear ZigZag trend lines visualize significant price swings. Users can adjust pivot sensitivity, label positioning, and color schemes for bullish, bearish, and trap moves to fit their trading style.
The tool employs a four-color system to represent market conditions: green for strong bullish moves (HH), red for strong bearish moves (LL), orange for bull traps (LH), and lime for bear traps (HL). This visual guide aids in spotting trend continuations and potential reversals. Alerts include detailed log messages and MTF notifications to keep traders informed.