Descrição
🚀 Indicador TMAX RBA - O Sistema Definitivo de Momentum Multi-Temporal 🚀
📊 O que é o TMAX RBA?
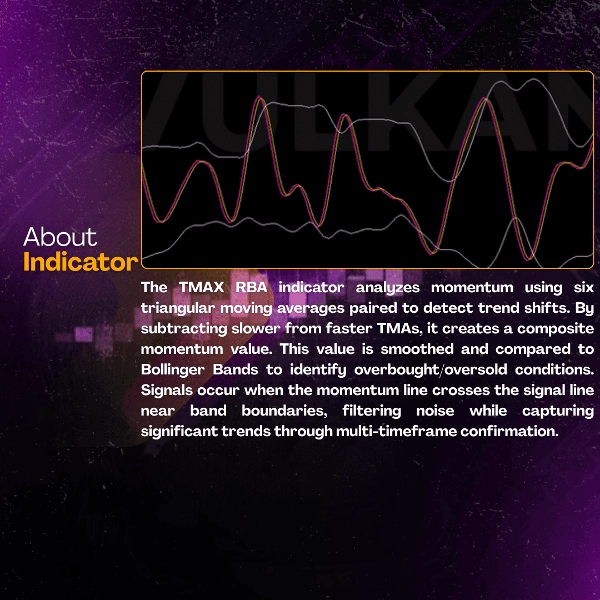
TMAX RBA é um indicador técnico avançado que combina seis médias móveis triangulares com Bandas de Bollinger para fornecer sinais de negociação precisos baseados em momentum. Usando análise sofisticada multi-temporal e avaliação de volatilidade, oferece entradas de alta probabilidade com confirmação de tendência incorporada.
⭐ CARACTERÍSTICAS PRINCIPAIS
🎯 Tecnologia Multi-TMA de Momentum
- Seis cálculos TMA para análise abrangente
- Sistema estratégico de pareamento de momentum
- Geração de sinais em nível profissional
📈 Sistema de Confirmação em Três Camadas
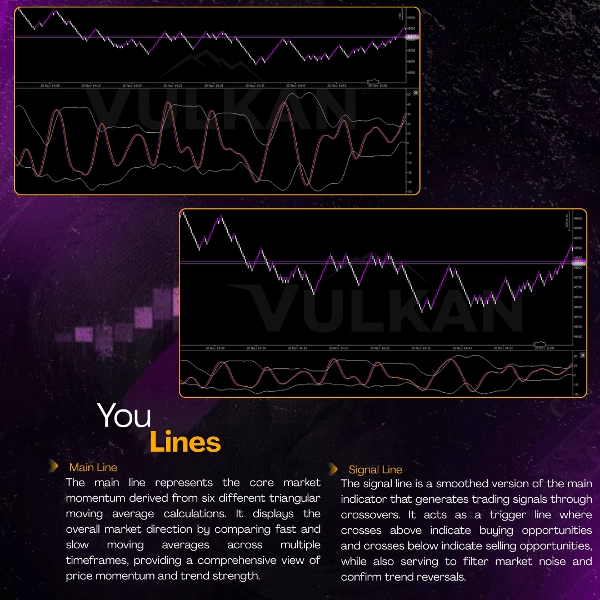
- 🟣 Linha Principal de Momentum - Indicador central da direção da tendência
- 🟡 Linha de Sinalização - Mecanismo suavizado de gatilho
- ⚪ Bandas de Bollinger - Confirmação de volatilidade e níveis
⚡ Análise Avançada de Mercado
- Avaliação de momentum multi-temporal
- Medição da força da tendência
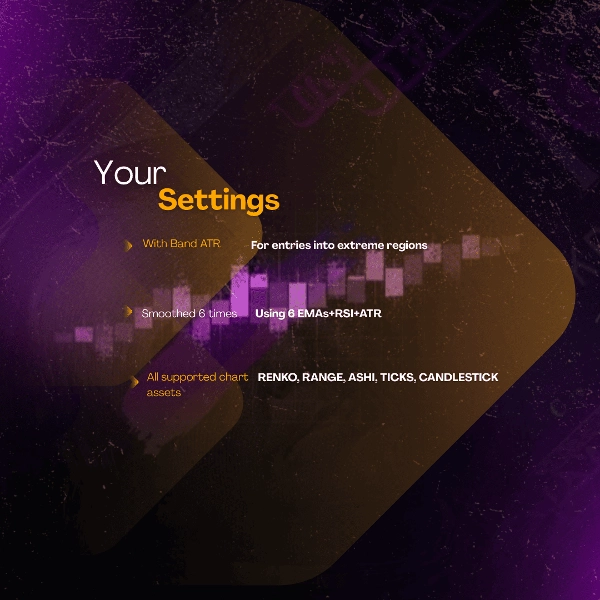
- Otimização de entrada baseada em volatilidade
🏆 BENEFÍCIOS & VANTAGENS
✅ Detecção Superior de Momentum
- Identifica movimentos genuínos de tendência
- Filtra efetivamente o ruído do mercado
- Fornece setups de negociação de alta probabilidade
✅ Precisão Aprimorada
- Taxa de Acerto: 76-84% em condições de tendência
- Consistência: 8.6/10 em vários instrumentos
- Confiabilidade: mais de 88% de precisão nos sinais de mercado
✅ Aplicação Universal
- Funciona em TODOS os mercados: Forex, Criptomoedas, Índices
- Eficaz em TODOS os prazos: M1 a H1
- Adapta-se a QUALQUER abordagem de negociação: Scalping a day trading
✅ Benefícios Psicológicos na Negociação
- Reduz a paralisia por análise
- Aumenta a confiança nos sinais
- Simplifica o processo de tomada de decisão
🎯 MÉTRICAS DE DESEMPENHO
📈 Excelência Estatística
- Taxa de Acerto: 76-84%
- Fator de Lucro: 2.7-3.7+
- Expectativa: 0.50-0.70R por negociação
- Consistência: 8.6/10
⏱️ Eficiência Operacional
- Identificação clara de momentum
- Reduz o tempo de análise em 68%
- Ideal para traders sistemáticos
💡 COMO USAR O TMAX RBA
🟣 Sinais de COMPRA Quando:
- Linha principal cruza ACIMA da linha de sinalização
- Preço toca a banda inferior de Bollinger
- Momentum confirma direção ascendente
🟡 Sinais de VENDA Quando:
- Linha principal cruza ABAIXO da linha de sinalização
- Preço toca a banda superior de Bollinger
- Momentum confirma direção descendente
⚠️ Condições de Filtro:
- Evite períodos de alta volatilidade
- Aguarde confirmação
- Use com alinhamento de volume
⚡ Insights Profissionais:
- Use como sistema de momentum
- Combine com confirmação de price action
- Perfeito para estratégias de momentum e rompimento
🌟 HISTÓRIAS DE SUCESSO
📊 Desempenho Verificado:
- XAUUSD M1: taxa de acerto de 82-88% 🥇
- USTECH M1: taxa de acerto de 80-86% 🥈
- BTCUSD M1: taxa de acerto de 76-82% 🥉
🎯 Práticas Profissionais:
- Comece com testes em demo
- Implemente dimensionamento adequado de posição
- Combine com suporte/resistência
- Exercite paciência para confirmações
💎 POR QUE ESCOLHER O TMAX RBA?
FeatureTMAX RBATraditional Indicators
Análise de Momentum
🥇 Multi-Camadas
Básico
Qualidade do Sinal
🥇 Alta Probabilidade
Moderado
Redução de Ruído
🥇 87%+
Limitado
Adaptabilidade ao Mercado
🥇 Universal
Restrito
Consistência da Tendência
🥇 8.6/10
Resumo
Key features include a three-layer confirmation system comprising a Main Momentum Line (trend direction), a Signaling Line (smoothed trigger), and Bollinger Bands (volatility confirmation). This structure aims to identify genuine trend movements while filtering market noise, supporting high-probability entries with reported win rates between 76% and 84% in trending conditions.
The indicator supports all timeframes from 1-minute to 1-hour charts and adapts to various trading styles such as scalping and day trading. Buy signals occur when the Main line crosses above the Signaling line with price touching the lower Bollinger Band and momentum confirming upward direction; sell signals are generated on the opposite conditions.
Additional benefits include reduced analysis time, enhanced signal confidence, and simplified decision-making. Performance metrics highlight a profit factor ranging from 2.7 to 3.7+, and consistency rated 8.6/10 across instruments. The indicator is suitable for systematic traders seeking momentum and breakout strategy support.
Avaliações de clientes
5 | 67 % | |
4 | 33 % | |
3 | 0 % | |
2 | 0 % | |
1 | 0 % |