
ADX and ADI
지표
258 다운로드
버전 1.0, Aug 2025
Windows, Mac
5.0
리뷰: 2
설명
주요 특징:
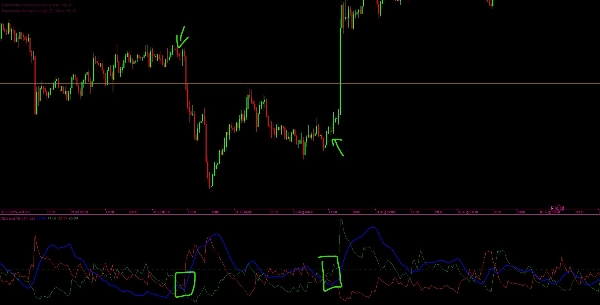
- ADX 및 ADI 선 (파란색): 방향에 관계없이 현재 추세의 부드럽게 처리된 강도를 보여줍니다.
- +DI 선 (녹색): 상승 움직임의 강도를 나타냅니다.
- -DI 선 (빨간색): 하락 움직임의 강도를 나타냅니다.
- 임계선 (회색): 추세 강도가 중요한지 식별하는 데 도움이 되는 수평 기준선(기본값 25)입니다.
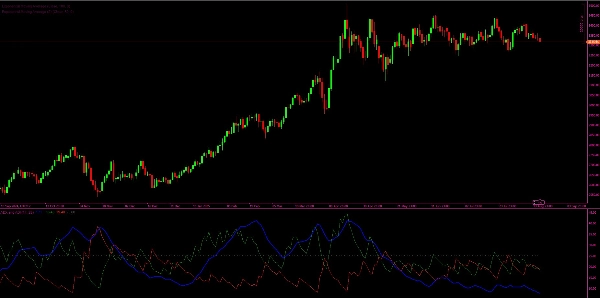
작동 원리:
- 지표는 진정 범위(TR), 양의 방향성 움직임(+DM), 그리고 음의 방향성 움직임(-DM)을 계산합니다.
- Wilder의 평활 기법을 적용하여 TR, +DM, -DM의 평활 값을 계산합니다.
- 여기서부터 방향성 지표(+DI 및 -DI)가 도출되어 어느 쪽(강세 또는 약세)이 더 강한 모멘텀을 가지는지 보여줍니다.
- 상대적 차이로부터 DX(방향성 지수)가 계산됩니다.
- 마지막으로, ADX(평균 방향성 지수)가 DX의 평활 버전으로 계산되어 전체 추세 강도를 제공합니다.
해석:
- ADX가 임계값(예: 25) 이상일 때, 시장은 강한 추세를 보이는 것으로 간주됩니다.
- +DI > -DI일 때, 강세장이 우세합니다 (상승 추세).
- -DI > +DI일 때, 약세장이 우세합니다 (하락 추세).
- ADX가 임계값 이하일 때, 시장은 횡보 중이거나 추세가 약한 상태로 간주됩니다.
요약
AI 요약
This custom indicator provides a full implementation of the Average Directional Index (ADX) and Directional Indicators (DI) to measure trend strength and direction in financial markets. It displays four key lines: the ADX and ADI line (blue) representing smoothed trend strength regardless of direction; the +DI line (green) indicating upward movement strength; the -DI line (red) indicating downward movement strength; and a threshold line (gray, default 25) to identify significant trend strength.
The indicator calculates True Range (TR), Positive Directional Movement (+DM), and Negative Directional Movement (-DM), applying Wilder’s smoothing technique to derive smoothed values. From these, it computes the +DI and -DI lines to show bullish or bearish momentum. The Directional Index (DX) is calculated from the relative difference between +DI and -DI, and the ADX is a smoothed version of DX, quantifying overall trend strength.
Interpretation guidelines include: ADX above the threshold signals a strong trend; +DI greater than -DI indicates bullish control; -DI greater than +DI indicates bearish control; and ADX below the threshold suggests a ranging or weak trend market.
지표 프로필
고객 리뷰
5.0
리뷰: 2
5 | 100 % | |
4 | 0 % | |
3 | 0 % | |
2 | 0 % | |
1 | 0 % |
고객 리뷰
December 1, 2025
ADX and ADI delivers clean trend strength and direction signals. ADX shows when the market is actually trending, while +DI and -DI reveal who’s in control. Stable, lightweight and reliable across all timeframes. Best on H1+ for smoother signals. Alerts and zone-highlighting would be great additions.
September 12, 2025
상담
자주 묻는 질문(FAQ)
트레이딩 봇, 지표, 플러그인 등 cTrader Store에서 제공되는 상품은 제3자 개발자에 의해 제공되며, 이는 단순히 정보 및 기술적 접근을 목적으로 제공된 것입니다. cTrader Store는 중개인이 아니며, 투자 조언, 개인별 추천 또는 향후 성과에 대한 어떠한 보장도 제공하지 않습니다.


!["[Stellar Strategies] MARSI Signal Plotter" 로고](https://cdn.ctrader.com/image/webp/7b2b8da6-8f8e-4646-8d4a-4710c516c01e_25567)


가격
가입일 21/02/2025
466.3M
거래량
180.83K
핍 수익
22
판매
6.89K
무료 설치