
Rsi + Volume
지표
707 다운로드
버전 1.0, Mar 2025
Windows, Mac
5.0
리뷰: 3
설명
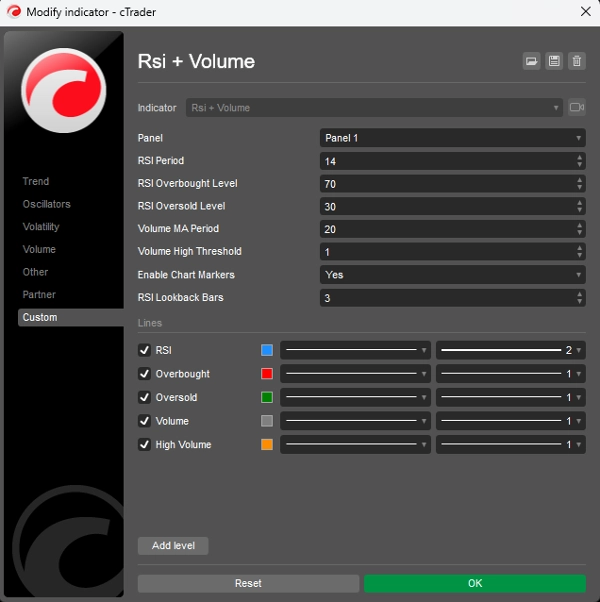
이 지표는 RSI(상대 강도 지수)와 거래량 분석을 결합하여 더 신뢰할 수 있는 거래 신호를 생성합니다. 중요한 가격 움직임은 그 움직임의 강도를 확인하기 위해 높은 거래량을 동반해야 한다는 원리에 기반합니다.
주요 구성 요소:
- RSI 분석:
-
- 0-100 범위에서 가격 움직임의 속도와 변화를 측정합니다
- 과매수 상태(70 이상)와 과매도 상태(30 이하)를 식별합니다
- 시장 내 잠재적 반전 지점을 파악하는 데 도움을 줍니다
- 거래량 분석:
-
- 현재 거래량을 최근 거래량의 이동 평균과 비교합니다
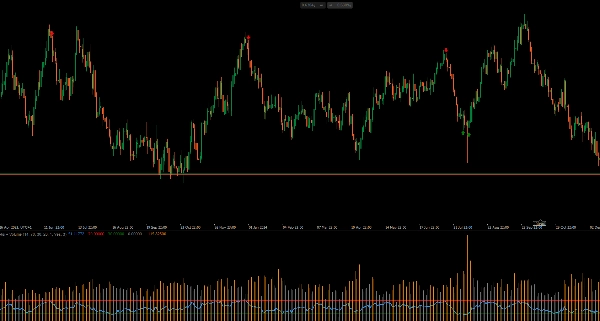
- 높은 거래량 기간을 강조 표시합니다(주황색 히스토그램 막대)
- 가격 움직임의 강도를 확인합니다
- 신호 생성:
-
- 매수 신호: RSI가 과매도 수준(30)을 상향 돌파하고 거래량이 높을 때
- 매도 신호: RSI가 과매수 수준(70)을 하향 돌파하고 거래량이 높을 때
- 시각적 신호는 차트에 직접 나타납니다(매수는 녹색 위쪽 화살표, 매도는 빨간색 아래쪽 화살표)
사용 방법:
- 가격이 하락 추세이고 RSI가 과매도 상태를 보일 때 매수 신호를 찾으세요
- 가격이 상승 추세이고 RSI가 과매수 상태를 보일 때 매도 신호를 찾으세요
- 높은 거래량은 신호의 강도를 확인합니다
- 거래 시간대에 맞게 매개변수(RSI 기간, 거래량 임계값)를 조정하세요
이 지표는 RSI 확인과 평균 이상의 거래량을 모두 요구하여 잘못된 신호를 걸러내므로 RSI만 사용하는 것보다 더 신뢰할 수 있습니다.
요약
AI 요약
The "Rsi + Volume" indicator integrates the Relative Strength Index (RSI) with volume analysis to enhance the reliability of trading signals. It operates on the principle that significant price movements should be confirmed by high trading volume.
Key components include:
1. RSI Analysis:
- Measures the speed and change of price movements on a 0-100 scale.
- Identifies overbought conditions (above 70) and oversold conditions (below 30).
- Helps detect potential market reversal points.
2. Volume Analysis:
- Compares current volume against a moving average of recent volume.
- Highlights periods of high volume using orange histogram bars.
- Confirms the strength behind price movements.
Signal generation occurs when RSI crosses key thresholds with accompanying high volume:
- Buy signals trigger when RSI rises above the oversold level (30) with high volume.
- Sell signals trigger when RSI falls below the overbought level (70) with high volume.
Visual signals appear directly on the chart as green up arrows for buys and red down arrows for sells.
Users can adjust parameters such as RSI period and volume threshold to fit their trading timeframe. This indicator aims to filter out false signals by requiring both RSI confirmation and above-average volume, providing more dependable trade signals than RSI alone.
지표 프로필
고객 리뷰
5.0
리뷰: 3
5 | 100 % | |
4 | 0 % | |
3 | 0 % | |
2 | 0 % | |
1 | 0 % |
고객 리뷰
October 12, 2025
Hello, the RSI +volume indicator is perfect, but it needed to have something: when the little arrow appears on the chart, it could show a notification or an alarm. Would you be able to add that alarm or notification in cTrader?
August 12, 2025
Pros: Combines RSI and volume for stronger trading signals. Works well when RSI threshold intersects with high volume spikes. Lightweight and clear visuals. Cons: No alerts or tooltips. Lacks template saving. May generate noise on low-volume timeframes without additional filters.
상담
자주 묻는 질문(FAQ)
Signal
Indices
RSI
트레이딩 봇, 지표, 플러그인 등 cTrader Store에서 제공되는 상품은 제3자 개발자에 의해 제공되며, 이는 단순히 정보 및 기술적 접근을 목적으로 제공된 것입니다. cTrader Store는 중개인이 아니며, 투자 조언, 개인별 추천 또는 향후 성과에 대한 어떠한 보장도 제공하지 않습니다.


가격
가입일 21/02/2025
466.3M
거래량
180.83K
핍 수익
22
판매
6.92K
무료 설치