설명
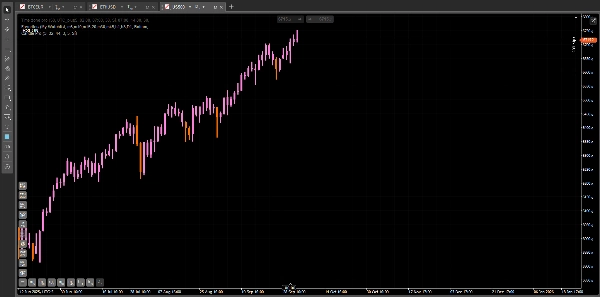
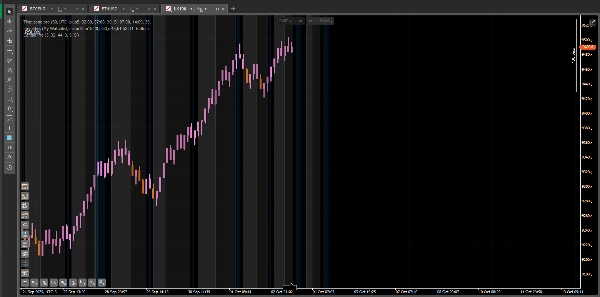
Candle Pro – 캔들에 표시된 시각적 RSI 신호
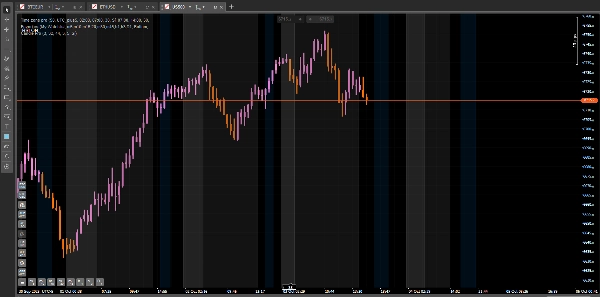
Candle Pro는 RSI가 과매수 또는 과매도 수준에 도달했을 때 차트에서 직접 캔들을 강조 표시하여 가격 움직임에 집중하고 추가 하위 차트를 피할 수 있게 해주는 지표입니다.
🧭 사용 방법
- 지표를 차트에 추가하세요.
- 거래 스타일에 맞게 RSI 매개변수를 조정하세요.
- 극단적인 수준에서 캔들이 색상이 변하는 것을 관찰하여 잠재적 반전 또는 모멘텀 구역을 표시합니다.
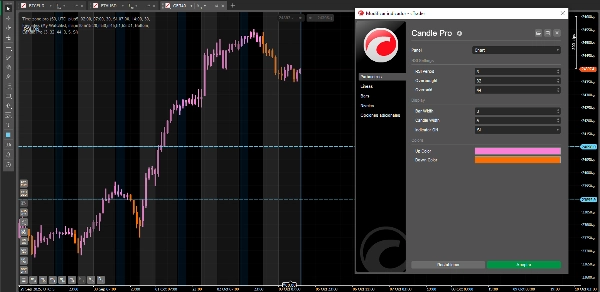
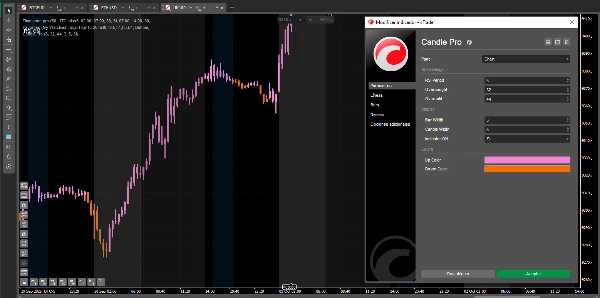
⚙️ 추천 설정
빠르고 정확한 반응을 위해:
- RSI 기간: 3
- 과매수: 32
- 과매도: 44
- 캔들 너비: 3
- 바 너비: 1
✨ 장점
- 가격에 직접 표시되는 깔끔한 시각 신호.
- 모든 심볼과 타임프레임에서 작동.
- 완전한 사용자 지정 가능한 색상과 선 너비.
- 스캘핑, 일중 거래, 그리고 스윙 트레이딩에 완벽합니다.
참고: 이것은 무료 버전의 Candle Pro입니다. 곧 독점 기능이 포함된 프리미엄 버전이 출시될 예정입니다. 이를 통해 거래를 한 단계 업그레이드할 수 있습니다.
요약
AI 요약
Candle Pro is a trading indicator designed to visually highlight RSI (Relative Strength Index) signals directly on price candles, eliminating the need for separate RSI sub-charts. It marks candles on the chart when RSI reaches overbought or oversold levels, helping traders identify potential reversal or momentum zones. Users can customize RSI parameters, candle colors, and line widths to suit their trading style. The indicator supports any symbol and timeframe, making it suitable for scalping, intraday, and swing trading strategies. Suggested settings include an RSI period of 3, overbought level at 32, and oversold level at 44 for fast and precise signals. Candle Pro emphasizes clean visual cues integrated with price action to maintain chart clarity. This version is the free edition, with a premium version planned to offer additional features. Supported markets include Forex, Indices, and Crypto.
지표 프로필
고객 리뷰
5.0
리뷰: 1
5 | 100 % | |
4 | 0 % | |
3 | 0 % | |
2 | 0 % | |
1 | 0 % |
고객 리뷰
November 3, 2025
This is an interesting indicator it really helps to filter out market noise. Thanks
상담
자주 묻는 질문(FAQ)
Forex
Indices
RSI
Crypto
트레이딩 봇, 지표, 플러그인 등 cTrader Store에서 제공되는 상품은 제3자 개발자에 의해 제공되며, 이는 단순히 정보 및 기술적 접근을 목적으로 제공된 것입니다. cTrader Store는 중개인이 아니며, 투자 조언, 개인별 추천 또는 향후 성과에 대한 어떠한 보장도 제공하지 않습니다.


!["[Hamster-Coder] Price" 로고](https://cdn.ctrader.com/image/webp/893fb641-d5b3-44d8-91fb-6a2dc6f3d309_30647)


가격
가입일 24/02/2025
15
판매
1.85K
무료 설치